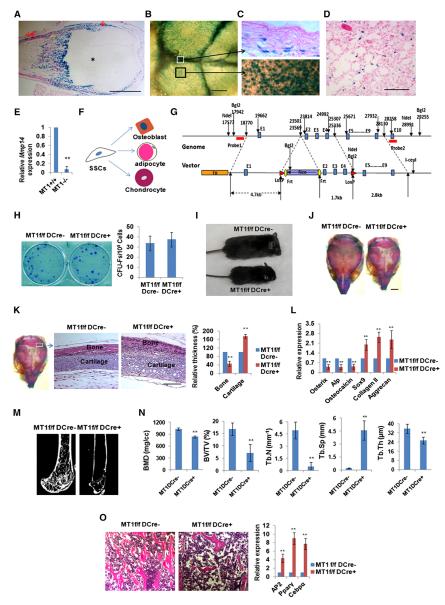
Figure 1. Expression and Genetic Inactivation of MT1-MMP in SSCs.
(A) LacZ expression in perichondrium (↓), periosteum (↓↓), and bone (Δ), but not cartilage (*), in 7-day-old Mmp14+/LacZ mouse femur. The scale bar represents 1 mm.
(B) LacZ expression in calvaria of a 10-day-old Mmp14+/LacZ mouse. The scale bar represents 500 μm.
(C) LacZ expression in sagittal suture mesenchymal progenitors (upper panel, section from the white boxed region in B) versus LacZ expression in mesenchymal progenitors and osteoblasts residing on the calvarial surface in 10-day-old Mmp14+/LacZ mice (black boxed region in B is enlarged). The scale bar represents 100 μm.
(D) LacZ expression in a subpopulation of bone-marrow cells in the femur of a 12-month-old Mmp14+/LacZ mouse. The scale bar represents 100 μm.
(E) Real-time PCR of Mmp14 expression in SSCs from 14-day-old Mmp14+/+ and Mmp14−/− mice (n = 3). Data are presented as mean ± SEM. **p < 0.01, unpaired t test.
(F) Schematic representation of the commitment of SSCs into three major lineages.
(G) Schematic of the Mmp14 genomic locus and targeting construct. After homologous recombination, the FRT-flanked Neo was inserted into the intron between exons 1 and 2, and two LoxP sites were inserted into the introns between exons 1 and 2 and exons 4 and 5.
(H) CFU-F generation from bone-marrow cells isolated from 4-week-old Mmp14f/f/Dermo1-Cre mice and control littermates (n = 6). Data are presented as mean ± SEM. Not significant, unpaired t test.
(I) Gross view of a 14-day-old Mmp14f/f/Dermo1-Cre mouse and its control littermate (Mmp14f/f).
(J) Alizarin red/Alcian blue staining of skulls isolated from 10-day-old Mmp14f/f and Mmp14f/f/Dermo1-Cre mice. The scale bar represents 2 mm.
(K) Histology of newborn Mmp14f/f and Mmp14f/f/Dermo1-Cre skulls across the lambdoid suture area (boxed area sectioned and magnified in the two panels to the right). Relative bone and cartilage thickness are shown to the right (n = 5). The scale bar represents 100 μm. Data are presented as mean ± SEM. **p < 0.01, unpaired t test.
(L) Relative mRNA expression of osteogenic and chondrogenic markers in newborn (1-day-old) calvarial RNA extracts from Mmp14f/f and Mmp14f/f/Dermo1-Cre mice (n = 6). Data are presented as mean ± SEM. **p < 0.01, unpaired t test.
(M) Microcomputed tomography of the proximal femur of 12-week-old Mmp14f/f and Mmp14f/f/Dermo1-Cre mice.
(N) Bone mineral density (BMD), bone volume/tissue volume (BV/TV), trabecular thickness (Tb.Th), trabecular number (Tb.N), and trabecular separation (Tb.Sp) measured by microcomputed tomography in 12-week-old Mmp14f/f and Mmp14f/f/Dermo1-Cre mice (n = 10). Data are presented as mean ± SEM. **p < 0.01, unpaired t test.
(O) Histology of femur bone-marrow cavity and relative mRNA expression of adipogenic markers in bone-marrow RNA extracts from 12-week-old Mmp14f/f and Mmp14f/f/Dermo1-Cre mice (n = 6). The scale bar represents 100 μm. Data are presented as mean ± SEM. **p < 0.01, unpaired t test.
See also Figure S1.

