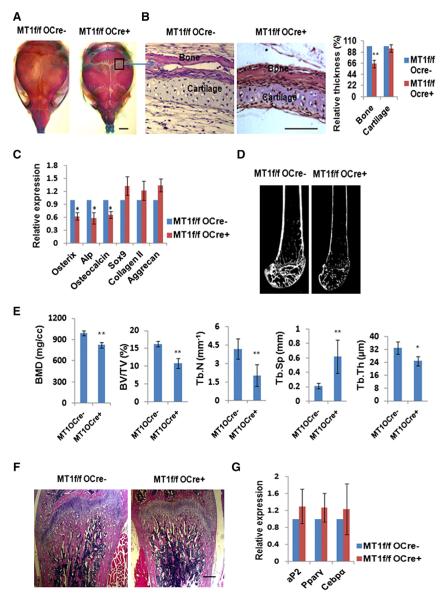
Figure 2. Osteopenia in Mice with Osteoblast Progenitor-Targeted Inactivation of MT1-MMP.
(A) Alizarin red/Alcian blue staining of skulls isolated from 10-day-old Mmp14f/f and Mmp14f/f/Osterix-GFP-Cre mice. The scale bar represents 2 mm.
(B) Histology of newborn Mmp14f/f and Mmp14f/f/Osterix-GFP-Cre mice skulls across the lambdoid suture area (boxed area in A, sectioned). Relative bone/cartilage thickness is shown to the right (n = 5). The scale bar represents 100 μm. Data are presented as mean ± SEM. **p < 0.01, unpaired t test.
(C) Relative mRNA expression of osteogenic and chondrogenic markers in 1-day-old calvarial RNA extracts from Mmp14f/f and Mmp14f/f/Dermo1-Cre mice (n = 6). Data are presented as mean ± SEM. *p < 0.05, unpaired t test.
(D) Microcomputed tomography of the proximal femur of 12-week-old Mmp14f/f and Mmp14f/f/Osterix-GFP-Cre mice.
(E) BMD, BV/TV, Tb.Th, Tb.N, and Tb.Sp were determined by microcomputed tomography in 12-week-old Mmp14f/f and Mmp14f/f/Osterix-GFP-Cre mice (n = 10). Data are presented as mean ± SEM. *p < 0.05, **p < 0.01, unpaired t test.
(F) Histology of femur from 12-week-old Mmp14f/f and Mmp14f/f/Osterix-GFP-Cre mice. The scale bar represents 1 mm.
(G) Relative mRNA expression of adipogenic markers in bone-marrow RNA extracts from 12-week-old Mmp14f/f and Mmp14f/f/Osterix-GFP-Cre mice (n = 6). Data are presented as mean ± SEM. Not significant, unpaired t test.
See also Figure S2.

