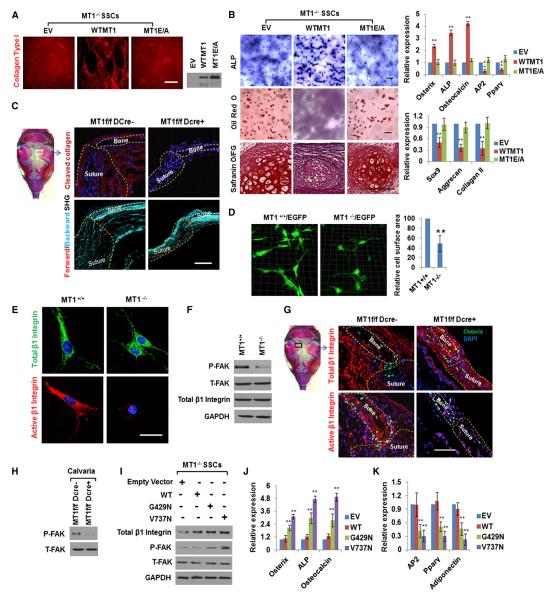
Figure 4. MT1-MMP-Dependent ECM Remodeling Regulates SSC Commitment by Activating β1-Integrin Signaling.
(A) MT1-MMP−/− SSCs were transduced with lentivirus expressing HA-tagged WT MT1-MMP (WTMT1), an MT1-MMP mutant (MT1E/A), or an empty vector (EV). Collagen degradation results are shown in the left-hand panel (collagen colored red). The scale bar represents 200 μm. The expression of the HA-tagged MT1-MMP proteins is shown in the right-hand panel.
(B) ALP and oil red O staining of SSCs from (A) cultured under osteogenic conditions in 3D collagen for 14 days or following safranin O staining of SSCs cultured under micromass chondrogenic conditions for 21 days. Relative mRNA expression of markers is shown in the right-hand panels (n = 3). The scale bars represent 100 μm. Data are presented as mean ± SEM. **p < 0.01, one-way ANOVA.
(C) Collagen cleavage in newborn (1-day-old) calvarial bone and suture. The scale bar represents 50 μm. In the lower panels, collagen deposition in newborn calvarial bone and suture is shown as detected by confocal imaging of SHG signals (forward scattering, red; backward scattering, blue). The scale bar represents 50 μm.
(D) Three-dimensional reconstruction and relative cell-surface area of SSCs isolated from Mmp14+/+/EGFP or Mmp14−/−/EGFP mice and cultured in 3D collagen. Data are presented as mean ± SEM. **p < 0.01, unpaired t test.
(E) Immunofluorescence of total (green) and active (red) β1-integrin in SSCs isolated from Mmp14+/+ or Mmp14−/− mice and cultured in 3D collagen. The scale bar represents 15 μm.
(F) Western blot of P-FAK, T-FAK, and total β1-integrin in SSCs isolated from Mmp14+/+ or Mmp14−/− mice and cultured in 3D collagen for 2 days.
(G) Immunofluorescence of total and active β1-integrin in newborn calvarial cells of Mmp14f/f or Mmp14f/f/Dermo1-Cre mice. The scale bar represents 50 μm.
(H) Western blot of P-FAK and T-FAK in calvarial lysates isolated from newborn Mmp14f/f or Mmp14f/f/Dermo1-Cre mice.
(I) MT1-MMP−/− SSCs transduced with an empty vector lentivirus or viruses expressing either the human WT or mutant β1-integrins (G429N or V737N) were cultured in 3D collagen gels for 2 days and probed with anti-β1-integrin, P-FAK, and T-FAK antibodies.
(J) Relative mRNA expression of osteogenic markers in the lentiviral-transduced cells from (I) cultured in 3D collagen for 7 days under osteogenic conditions (n = 3). Data are presented as mean ± SEM. **p < 0.01, one-way ANOVA.
(K) Relative mRNA expression of adipogenic markers in SSCs shown in (I) cultured under adipogenic conditions in 3D collagen for 7 days (n = 3). Data are presented as mean ± SEM. **p < 0.01, one-way ANOVA.
See also Figure S4.

