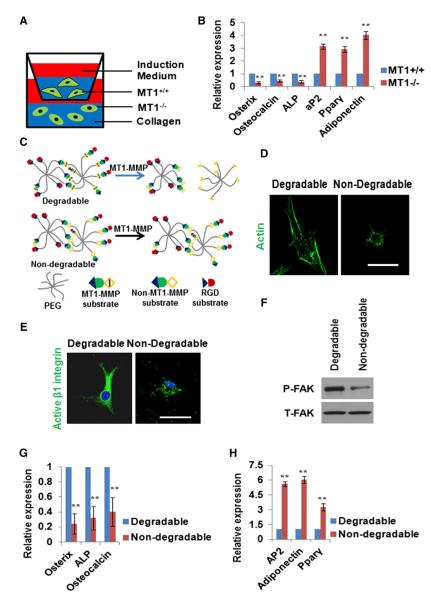
Figure 5. β1-Integrin Activation and Three-Dimensional Cell-Shape Change.
(A) Schematic of MT1-MMP+/+ and MT1-MMP−/− SSCs in 3D collagen coculture for 7 days under dual osteogenic/adipogenic induction.
(B) Osteogenic and adipogenic markers quantified by real-time PCR in MT1-MMP+/+ and MT1-MMP−/− SSCs cocultured as described in (A) (n = 3). Data are presented as mean ± SEM. **p < 0.01, unpaired t test.
(C) Schematic of PEG-based hydrogel. MT1-MMP-sensitive or -insensitive peptides were crosslinked to the PEG backbone with a cell-adhesive RGD peptide integrated into the hydrogel.
(D) Phalloidin staining of MT1-MMP wild-type SSCs cultured in MT1-MMP-degradable or -nondegradable hydrogels for 15 days. The scale bar represents 10 μm.
(E) Immunofluorescence of active β1-integrin in SSCs cultured in 3D PEG-based hydrogel for 15 days. The scale bar represents 15 μm.
(F) Western blot of P-FAK and T-FAK in SSCs cultured in 3D PEG-based hydrogel for 15 days.
(G) Relative mRNA expression of osteogenic markers in MT1-MMP+/+ SSCs cultured in 3D hydrogels (MMP-degradable or -nondegradable) for 15 days followed by a 7 day period under dual osteogenic/adipogenic induction (n = 3). Data are presented as mean ± SEM. **p < 0.01, unpaired t test.
(H) Relative mRNA expression of adipogenic markers in MT1-MMP+/+ SSCs cultured in 3D hydrogels (MMP-degradable or -nondegradable) for 15 days followed by a 7 day period under dual induction conditions (n = 3). Data are presented as mean ± SEM. **p < 0.01, unpaired t test.
See also Figure S5.

