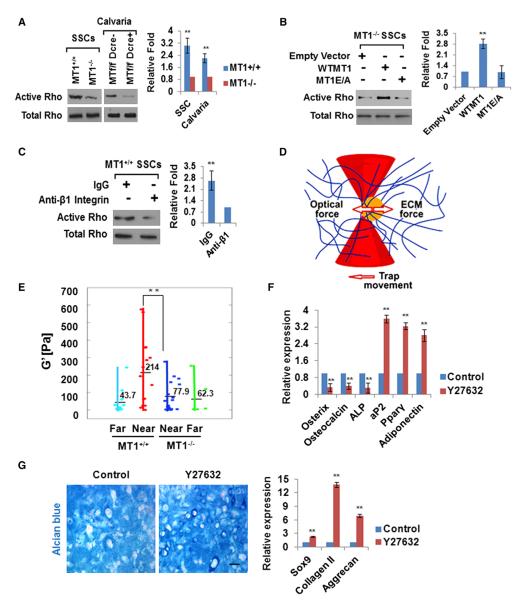
Figure 6. ECM Remodeling Regulates RhoGTPase Signaling, Pericellular Rigidity, and SSC Commitment.
(A) Active and total RhoGTPase levels were determined in SSCs isolated from Mmp14+/+ or Mmp14−/− mice and cultured in 3D collagen for 2 days as well as in newborn calvarial lysates isolated from Mmp14f/f or Mmp14f/f/Dermo1-Cre mice. Data are presented as mean ± SEM. **p < 0.01, unpaired t test.
(B) Active and total RhoGTPase levels were determined in SSCs isolated from Mmp14−/− mice that were transduced with empty vector or lentiviral constructs expressing WT MT1-MMP (WTMT1) or mutant MT1-MMP (MT1E/A) and cultured in 3D collagen for 2 days. Data are presented as mean ± SEM. **p < 0.01, one-way ANOVA.
(C) Active and total RhoGTPase levels in SSCs isolated from Mmp14+/+ mice and cultured in 3D collagen with rat IgG or anti-β1-integrin antibody for 2 days. Data are presented as mean ± SEM. **p < 0.01, unpaired t test.
(D) Schematic of local collagen rigidity assayed by microrheology. Beads are trapped and oscillated in a laser trap where bead position is detected by a quadrant photodiode. The interaction between the elastic force from the matrix and the optical force from the laser is used to determine the elastic modulus (G’).
(E) G’ values near (<5 μm) and distant (>100 μm) from MT1-MMP+/+ and MT1-MMP−/− SSCs cultured in 3D collagen are shown. Each point represents the average G’ (across frequencies) for each bead. Data are presented as mean ± SEM. **p < 0.01, one-way ANOVA.
(F) Relative mRNA expression of osteogenic and adipogenic markers in MT1-MMP+/+ SSCs cultured in 3D collagen and treated with or without 10 μM Y27632 for 7 days under osteogenic or adipogenic conditions, respectively (n = 3). Data are presented as mean ± SEM. **p < 0.01, unpaired t test.
(G) Alcian blue staining of MT1-MMP+/+ SSCs cultured in 3D collagen and treated with or without 10 μM Y27632 for 21 days under chondrogenic conditions. The scale bar represents 100 μm. Relative mRNA expression of chondrogenic markers is shown in the right-hand panel (n = 3). Data are presented as mean ± SEM. **p < 0.01, unpaired t test.
See also Figure S6.

