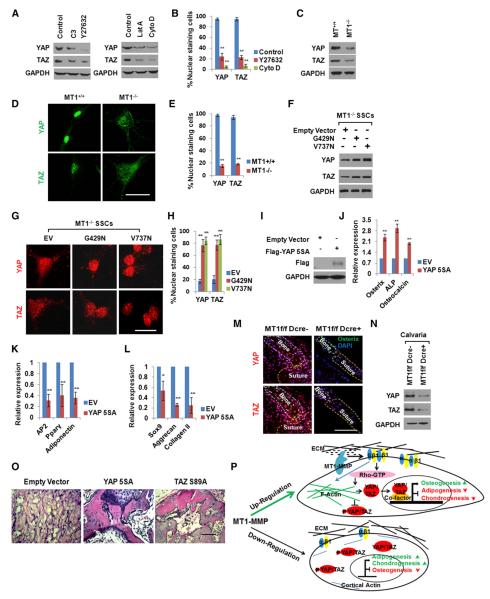
Figure 7. MT1-MMP-Dependent YAP/TAZ Activation Triggers SSC Commitment.
(A) YAP and TAZ expression levels in MT1-MMP+/+ SSCs embedded in 3D collagen gels for 2 days and treated with Rho inhibitor C3 (3 μg/ml), ROCK inhibitor Y27632 (10 μM), latrunculin A (Lat A; 0.5 μM), or cytochalasin D (CytoD; 1 μM).
(B) Quantification of nuclear-stained cells from (A) (n = 3). Data are presented as mean ± SEM. **p < 0.01, one-way ANOVA.
(C) YAP and TAZ expression levels in MT1-MMP+/+ or MT1-MMP−/− SSCs embedded in 3D collagen gels for 2 days.
(D) YAP and TAZ localization in MT1-MMP+/+ or MT1-MMP−/− SSCs embedded in 3D collagen gels for 2 days. The scale bar represents 20 μm.
(E) Quantification of nuclear-stained cells from (D) (n = 3). Data are presented as mean ± SEM. **p < 0.01, unpaired t test.
(F) YAP and TAZ expression levels in MT1-MMP−/− SSCs infected with an empty vector or lentiviral constructs expressing G429N or V737N β1-integrin mutants and cultured in 3D collagen for 2 days.
(G) YAP and TAZ localization in cells from (F) embedded in 3D collagen gels for 2 days. The scale bar represents 20 μm.
(H) Quantification of nuclear-stained cells from (G) (n = 3). Data are presented as mean ± SEM. **p < 0.01, one-way ANOVA.
(I) Expression of YAP-5SA probed with an anti-Flag antibody in MT1-MMP−/− SSCs infected with a lentiviral empty vector or virus expressing Flag-tagged YAP-5SA.
(J) Osteogenic marker expression in MT1-MMP−/− SSCs infected with a lentiviral control vector or virus expressing Flag-tagged YAP-5SA, embedded in 3D collagen, and cultured for 7 days under osteogenic conditions (n = 3). Data are presented as mean ± SEM. **p < 0.01, unpaired t test.
(K) Adipogenic marker expression in MT1-MMP−/− SSCs infected with a lentiviral control vector or virus expressing Flag-tagged YAP-5SA, embedded in 3D collagen, and cultured for 7 days under adipogenic conditions (n = 3). Data are presented as mean ± SEM. **p < 0.01, unpaired t test.
(L) Chondrogenic marker expression in MT1-MMP−/− SSCs infected with a lentiviral control vector or a virus expressing Flag-tagged YAP-5SA and cultured in 3D collagen for 14 days under chondrogenic conditions (n = 3). Data are presented as mean ± SEM. *p < 0.05, **p < 0.01, unpaired t test.
(M) YAP and TAZ localization in newborn calvaria of Mmp14f/f or Mmp14f/f/Dermo1-Cre mice. The scale bar represents 50 μm.
(N) YAP and TAZ protein levels in newborn Mmp14f/f or Mmp14f/f/Dermo1-Cre calvarial lysates.
(O) Histology of tissue isolated from mice transplanted with MT1-MMP−/− SSCs transduced with a lentiviral control vector or viruses expressing either Flag-tagged YAP-5SA or TAZ-S89A (n = 5). The scale bar represents 100 μm.
(P) Schematic model of MT1-MMP-dependent control of SSC lineage commitment.
See also Figure S7.

