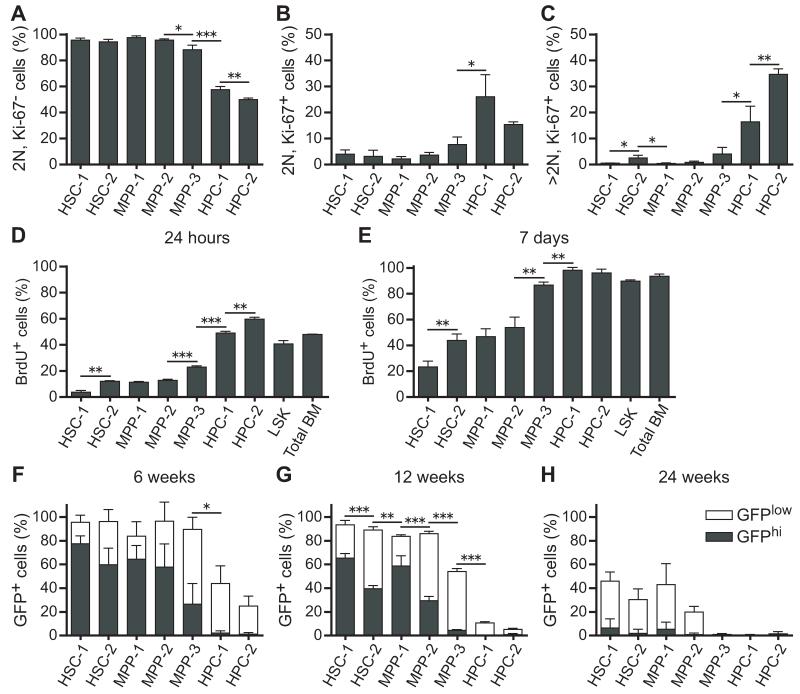
Figure 2. Cell cycle status of each hematopoietic stem and progenitor cell fraction.
(A-C) The frequency of cells in G0 (A; Ki-67−, 2N DNA content), G1 (B; Ki-67+, 2N DNA content), and S/G2/M (C; Ki-67+, >2N DNA content) phases of the cell cycle.
(D and E) The frequency of BrdU+ cells in each fraction after 24 hours (D) or 7 days (E) of BrdU administration.
(F-H) Expression of histone H2B-GFP was induced in hematopoietic cells by doxycycline administration for 6 weeks then chased for 6 weeks (F), 12 weeks (G), or 24 weeks (H) without doxycycline to monitor the rate of H2B-GFP dilution. Filled and open bars represent the proportion of GFPhi and GFPlo cells, respectively, in each population. The gating scheme used to identify GFPhi and GFPlo cells is shown in Figure S2. Data represent mean ± S.D. from 2 independent experiments with a total of 4 mice (F and G) or 3 independent experiments with a total of 7 mice (A-E, H). *p<0.05; **p<0.01; ***p<0.001 by Student’s t-test. Statistical analyses in F-H compared only the frequency of GFPhi cells among cell populations. See also Figure S3.

