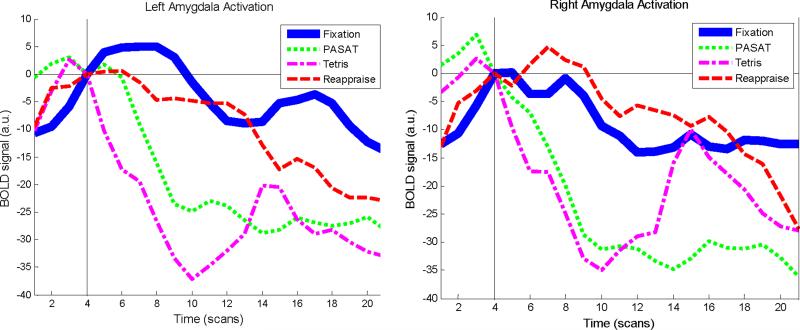
Figure 3.
Line graphs showing baseline-corrected BOLD signal over time during each of the four task conditions in anatomically defined left and right amygdala. Vertical black line indicates the start of the active task period. Mixed models analysis revealed a significant main effect of condition and a significant condition × hemisphere interaction.

