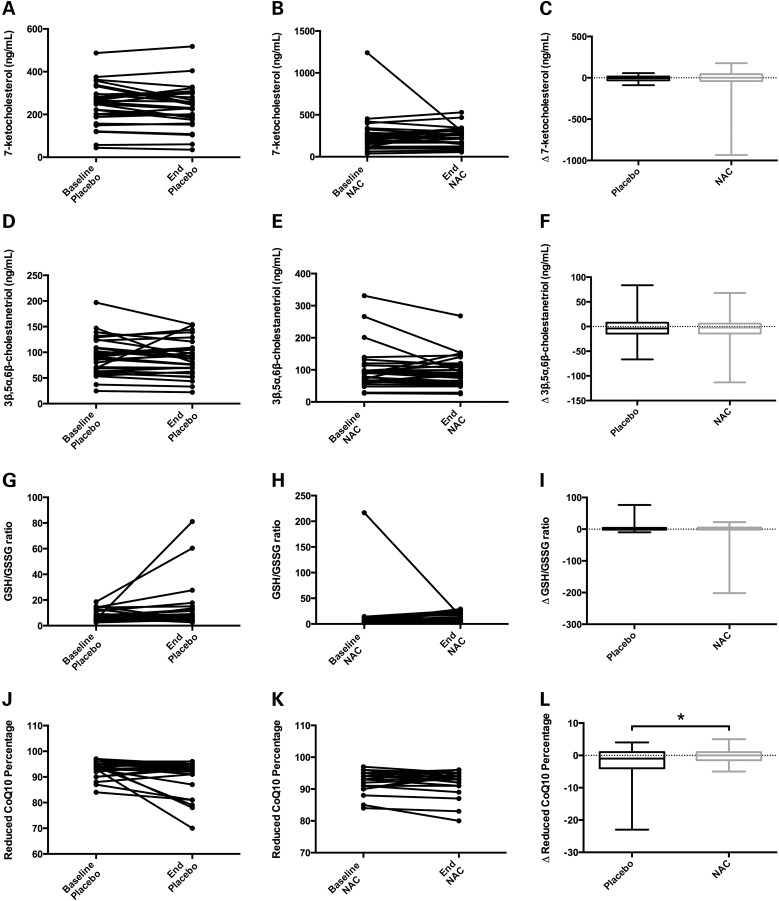
Figure 10.
Administration of NAC to NPC1 patients in a crossover clinical trial shows little evidence of phenotypic rescue. A, D, G, and J show individual patient measurements at baseline and end of the placebo phase (each connected by a line) for 7-ketocholesterol (7-KC), 3β,5α,6β-cholestanetriol (3β,5α,6β-triol), reduced to oxidized glutathione (GSH/GSSG) ratio, and reduced CoQ10 percentage, respectively. B, E, H and K show individual patient measurements at baseline and end of the NAC treatment phase for these same biochemical measurements. The box-and-whisker plots in C, F, I, and L show the change (Δ) in the same biochemical measurements for each patient during placebo and NAC phases. (A–F) Plasma levels of 7-KC (A–C) and 3β,5α,6β-triol (D–F) showed no significant changes resulting from NAC treatment in NPC1 patients. The mean 7-KC levels (in ng/mL) were as follows: baseline placebo = 245, end placebo = 235, baseline NAC treatment = 265, and end NAC treatment = 239. Mean 3β,5α,6β-triol levels (in ng/mL) were as follows: baseline placebo = 91.9, end placebo = 88.9, baseline NAC treatment = 101, and end NAC treatment = 94.1. (G–I) GSH/GSSG levels were unchanged in NAC-treated NPC1 patients when compared with placebo levels. Mean GSH/GSSG ratios were as follows: baseline placebo = 7.2, end placebo = 12.2, baseline NAC treatment = 13.8, and end NAC treatment = 9.4. (J–L) The percentage of reduced CoQ10 in NPC1 patients was maintained at a slightly higher level during NAC treatment when compared to placebo treatment, and the Δ reduced CoQ10 percentage was significantly different between NAC and placebo (panel L, P = 0.02). Mean reduced CoQ10 percentages were as follows: baseline placebo = 93.5, end placebo = 90.9, baseline NAC treatment = 93.2, and end NAC treatment = 93.0. Data analyzed by Wilcoxon-matched pairs signed rank-test.

