Figure 6.
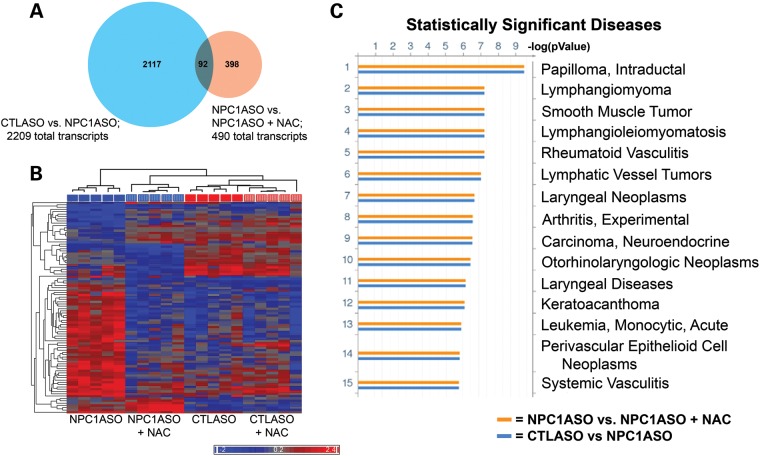
Microarray analysis of NPC1ASO and NAC-treated NPC1ASO liver shows that NAC treatment induces expression changes distinct from those of NPC1ASO alone. (A) A venn diagram illustrates that 92 transcripts have statistically significant expression changes in both CTLASO versus NPC1ASO (2209 total transcripts) and NPC1ASO versus NPC1ASO + NAC (490 total transcripts). (B) Hierarchical clustering with the 92 common transcripts shared between CTLASO versus NPC1ASO and NPC1ASO versus NPC1ASO + NAC. Similar transcript expression patterns grouped NPC1ASO + NAC (vertically striped blue) with CTLASO (solid red) in the dendogram, consistent with NAC restoring some normal gene expression in NPC1ASO. When data from CTLASO + NAC were included (vertically striped red), few expression differences were seen between CTLASO and CTLASO + NAC, suggesting that the observed NAC-induced changes in NPC1ASO mice are specific to the NPC1 knockdown conditions. (C) Functional ontology enrichment analysis (GeneGo MetaCore) was performed to identify significantly altered pathways with the 92 common transcripts. Shown here are the results of disease biomarkers analysis, showing numerous cancer-related pathways that suggest cell cycle alterations. These differ from the lysosomal- and lipid-related pathways identified by analysis of the transcripts altered in NPC1ASO treatment (see Fig. 2C). The histograms indicate FDR-corrected P-values for the association of the indicated disease pathways with experimental gene expression changes in CTLASO versus NPC1ASO (blue) or NPC1ASO versus NPC1ASO + NAC (orange). Additional MetaCore results are shown in Supplementary Material, Fig. S4.

