Figure 2.

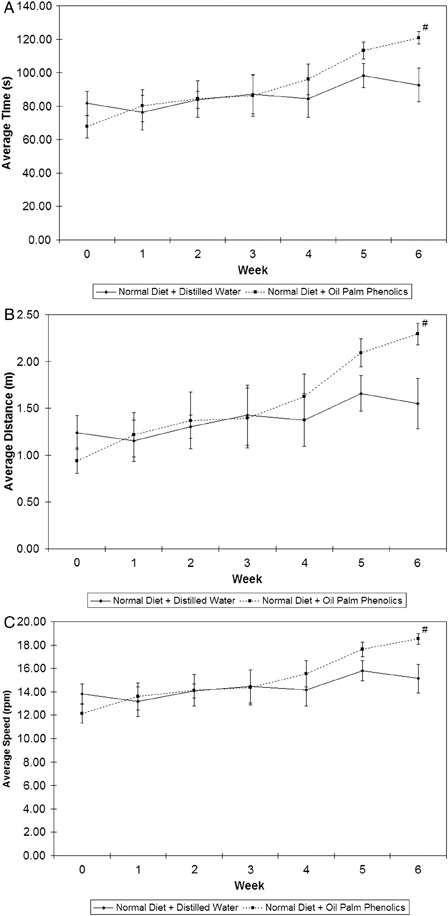
Results of rotarod trials. (A) Average time; (B) average distance; (C) average stopping speed. #P < 0.05 versus normal diet + distilled water; n = 5; mean ± SEM.

Results of rotarod trials. (A) Average time; (B) average distance; (C) average stopping speed. #P < 0.05 versus normal diet + distilled water; n = 5; mean ± SEM.