
Fig. 7.
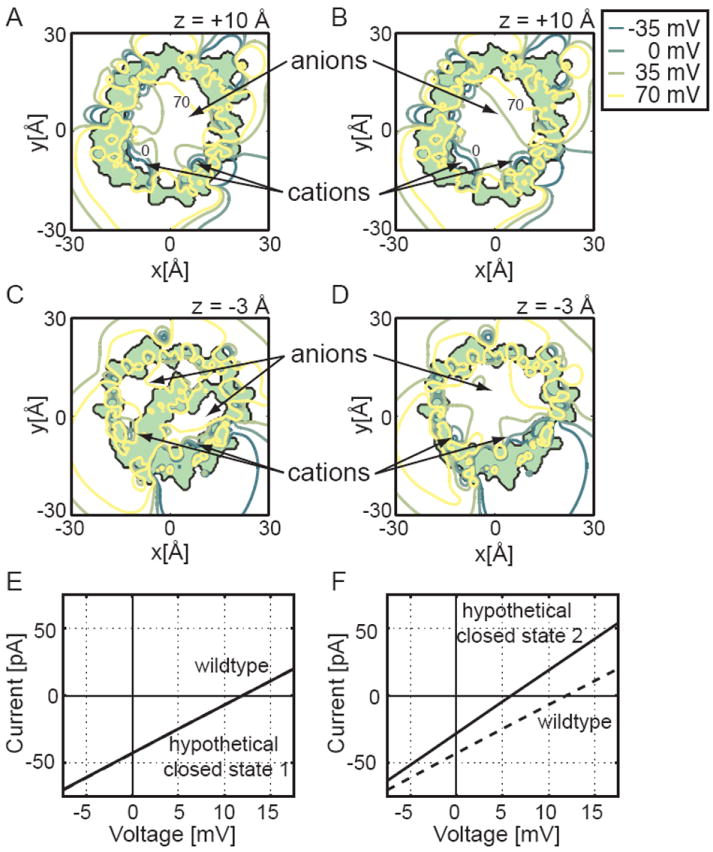
Biophysical properties of the two hypothetical closed states. The electrostatic potential of hypothetical closed state 1 was calculated and plotted at z = +10 Å (A) and z = -3 Å (C), and the isocontours for hypothetical closed state 2 were plotted at z = +10 Å (B) and z = -3 Å (D). Each channel is viewed along the pore’s long axis, and the protein interior is shaded light green. We see in panel C that the N-terminal helix occludes the middle of the pore of hypothetical closed state 1, but panels B and D show that hypothetical closed state 2 has an unobstructed pore at all levels. As in Fig. 4, four equally spaced isocontours are depicted with dark green curves representing negative potentials and yellow curves representing more positive potentials. From panel C we see that closed model 1 has only a very small portion of the pore favorable to cation passage. Current-voltage curves for closed state 1 (E) and closed state 2 (F) were also carried out using PNP calculations. The conductance of hypothetical closed state 1 (solid) is so similar to wild type (dashed) that it is hard to distinguish both curves. Due to the larger pore diameter, hypothetical closed state 2 has an increased conductance, indicated by a steeper slope (solid curve) compared to the wild type (dashed). Since the current-voltage curve in panel F crosses the x-axis at a positive potential, the channel is anion selective as is the wild-type channel.