
Figure 1.
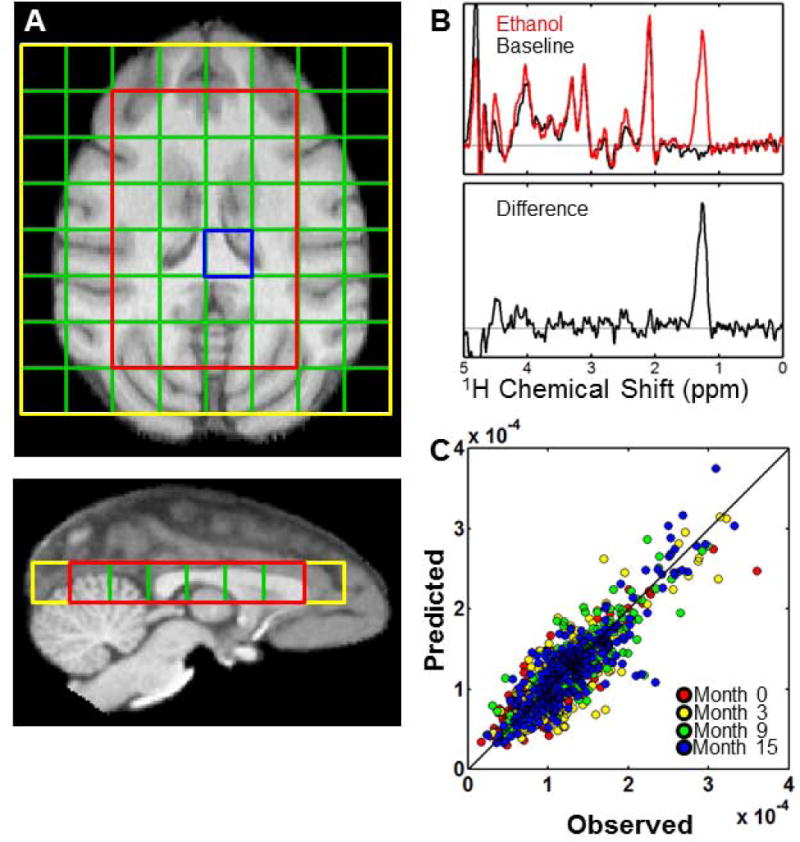
Quantification of ethanol MRS signal intensity in GM and WM. (A) Overlay of the 8×8 grid of (8 mm)3 CSI voxels n an axial T1-weighted image. The region outlined in red is the PRESS-selected volume, within which ethanol and H2O resonances were quantified. (B) Example spectra acquired prior to (black trace) and following (red trace) intravenous infusion of ethanol. The ethanol methyl 1H signal is determined from the difference spectrum (lower trace). (C) Observed (abscissa) vs. expected (ordinate) values obtained for the 995 voxels quantified, after using Eqs. [7]–[9] to estimate and for each monkey at each of the four time points. Data values are color-coded according to the experimental time point in which they were acquired.