
Figure 2.
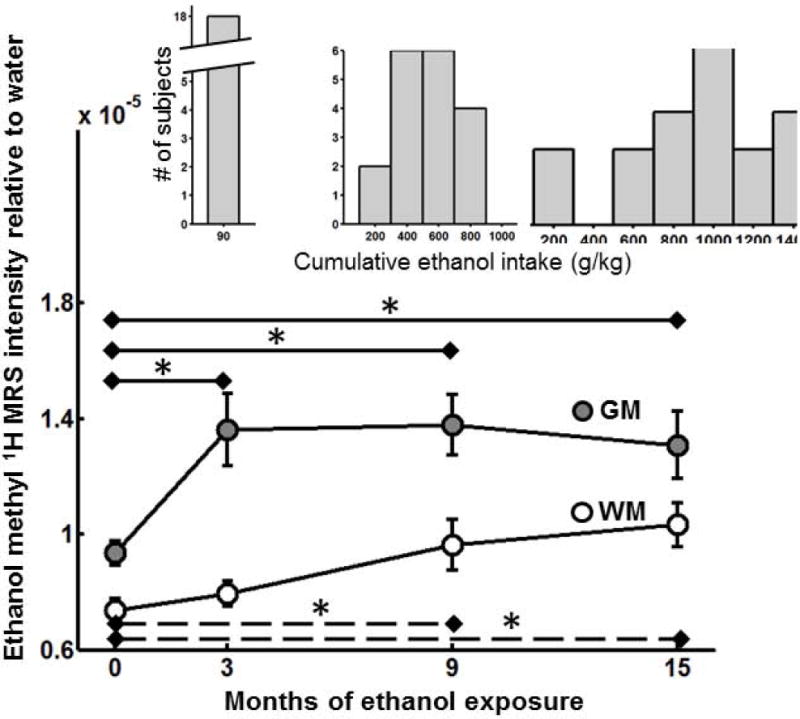
Ethanol MRS intensity increases with exposure in GM and WM. Average ± standard errors in (gray filled circles) and (open circles) are plotted vs. experimental time points. Ethanol MRS intensity in GM is significantly larger at all subsequent time points than it was in the ethanol-naïve state (asterisks, solid lines). In WM, ethanol MRS intensity is observed to be significantly higher than in the ethanol-naïve state following 9, as well as following 12 months 22 hours free-access drinking (asterisks, dashed lines). The distributions of cumulative ethanol intakes following each drinking period are shown as insets.