
Figure 3.
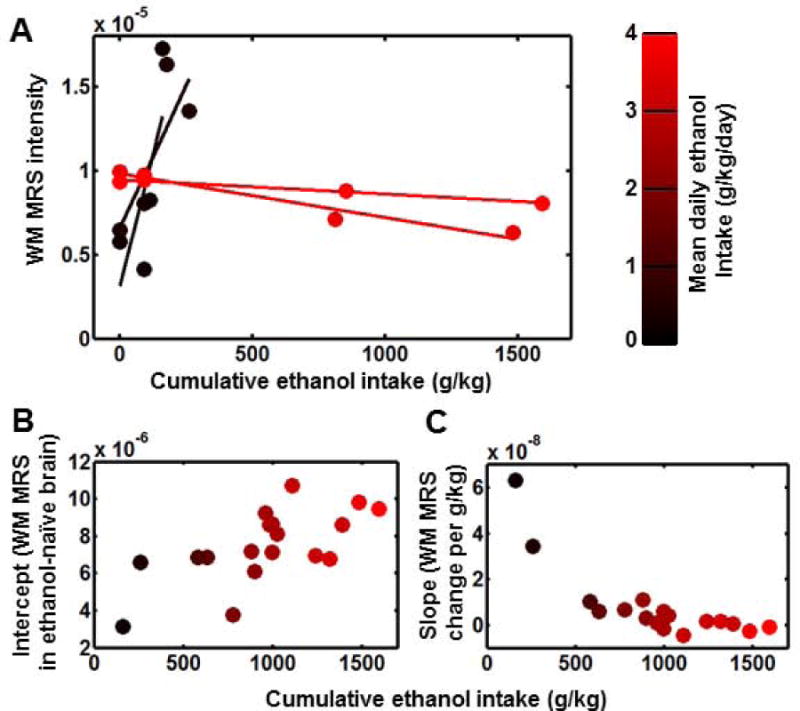
The relationship between drinking behavior and ethanol MRS intensity changes in WM. (A) WM MRS intensity as a function of cumulative ethanol intake for two heaviest (red) and two lightest (black) drinkers of the 18 monkeys over the course of the experiment. Data values for each monkey are fitted to linear expressions, as illustrated by the solid lines. (B) and (C) are intercepts and slopes, respectively, of the resulting lines are plotted as a function of cumulative ethanol intake. For all panels, data are color-coded by mean daily ethanol intake as shown in the color scale.