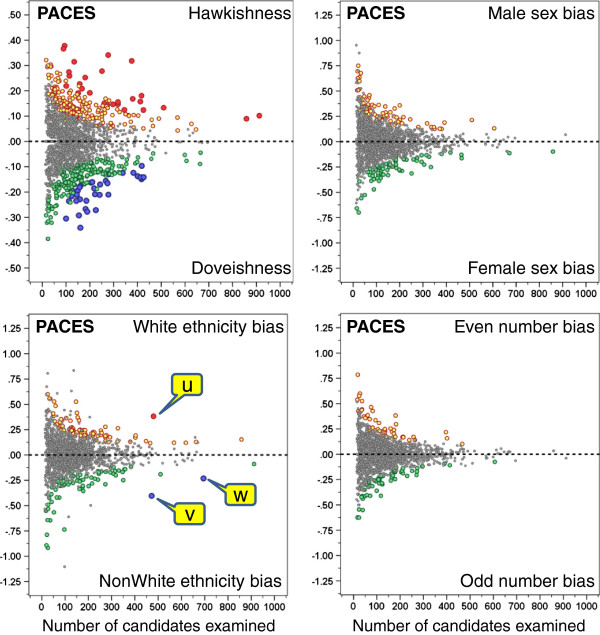
Figure 1.
The individual graphs show for PACES diets 1–26 the indices for hawkishness (top left), sex bias (top right), ethnic bias (lower left), and even-number bias (lower right). Each point represents an individual examiner, plotted against the number of candidates examined, and with the significance indicated (grey, NS; orange and green p < .05 uncorrected; red and blue, p < .05 Bonferroni corrected).

