Figure 2.
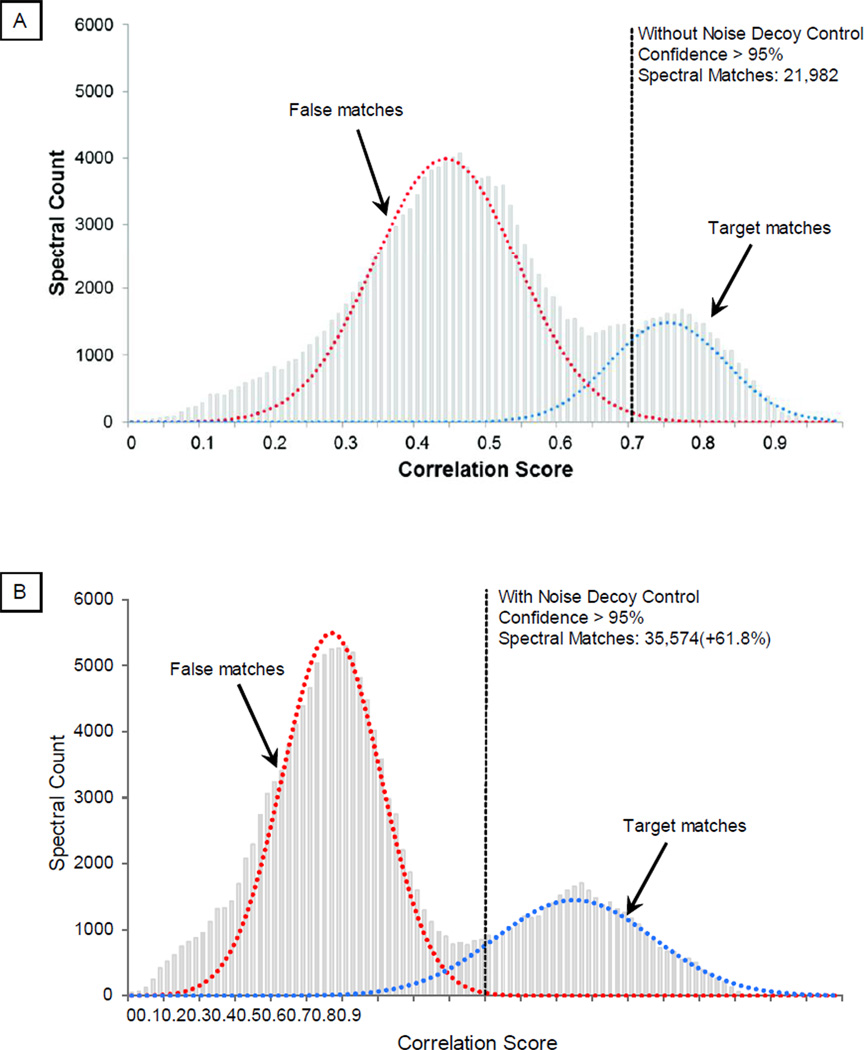
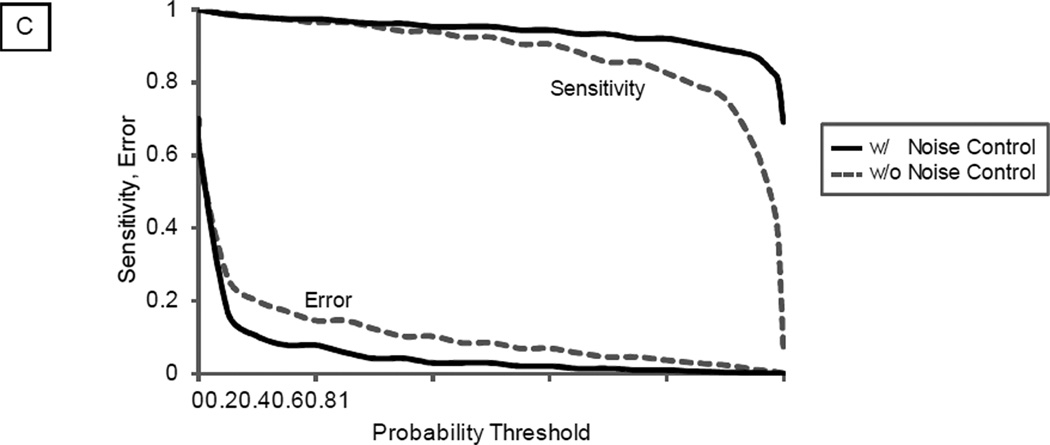
Distinguishing Correct Matches from False Matches. The distribution of the correlation score can be used to separate correct spectral matches from false matches via a mechanism analogous to PeptideProphet. A. Without the noise control, the distribution of correlation scores for correct matches and false matches significantly overlapped. At a statistical threshold of 95% confidence, a total of 21,982 spectral matches were filtered. B. The distribution of correlation scores for correct and false matches was better separated with noise control. At a statistical threshold of 95% confidence, a total of 35,574 spectral matches were filtered (a 61.8% increase), illustrating higher identification sensitivity. C. The impact of noise control strategy on identification sensitivity and error was illustrated in relation to probability threshold.


