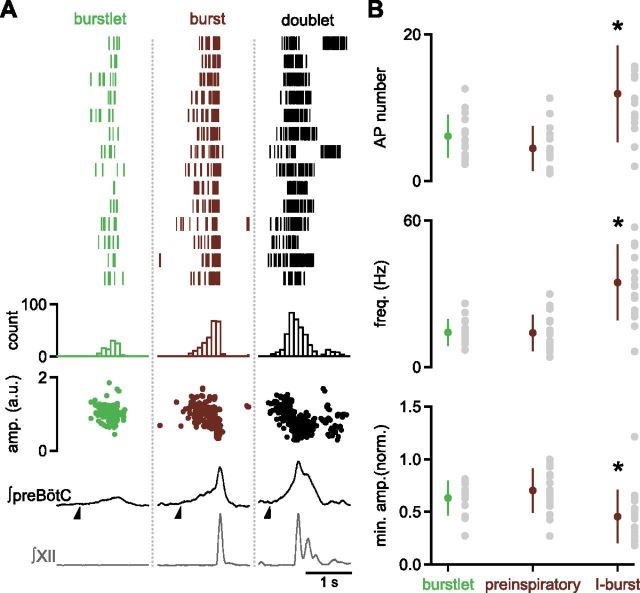
Figure 6.
Characteristics of preBötC neuron firing patterns during burstlets and bursts. A, Top, APs during burstlets (left, green), bursts (middle, maroon), or doublets (right, black) of one preBötC inspiratory-modulated neuron. Each line of each column of the raster plot represents APs of recorded neuron during a single burstlet, burst, or doublet. A, Middle, Histograms of raster plots show the average AP frequency during burstlets, bursts, and doublets. A, Bottom, Amplitudes of APs over time during burstlets, bursts, and doublets are shown below the histograms. Time course of amplitude shows that AP waveform does not change significantly during burstlets, but decreases during bursts and doublets. After a pause in firing during some doublets, more APs are seen, corresponding to a second peak in the doublet. Raster plots, histograms, and amplitudes in a.u. are aligned to the average burstlet or XII burst/doublet waveform. Half-arrow indicates onset of preBötC burstlet, burst, and doublet. B, Comparison of firing pattern properties including AP number, frequency, and minimum amplitude normalized to the first AP in the event during burstlets (green), and the preinspiratory and I-burst components (maroon) of bursts in inspiratory-modulated neurons. Data are mean ±SD (*p < 0.05; n = 16) with means for each slice as gray circles.

