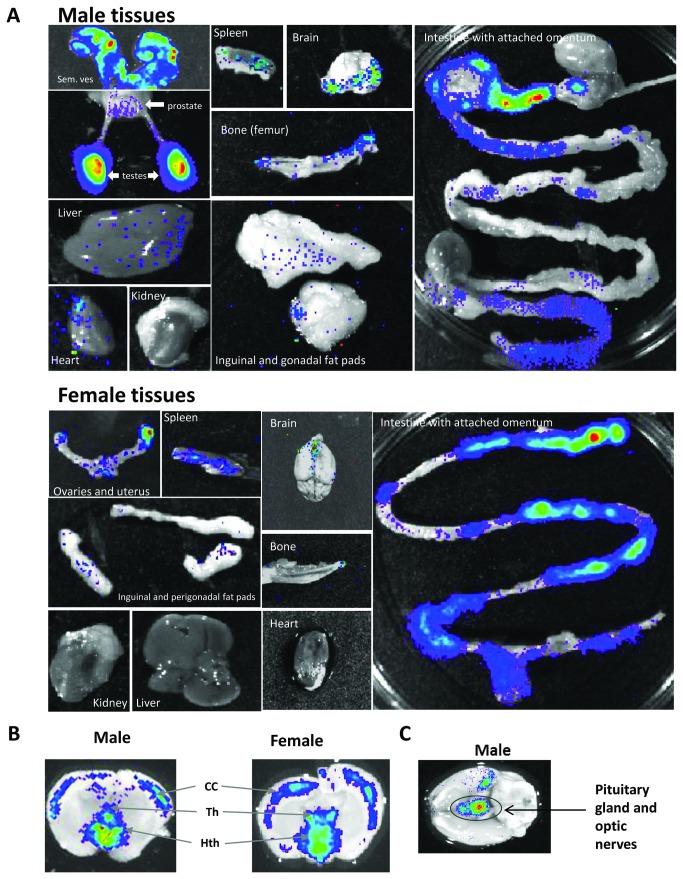
Figure 3. Bioluminescence analysis of ex vivo tissues.
Ex vivo bioluminescence imaging of tissues taken from ARE-Luc mice injected with 150mg/kg luciferin substrate and killed and dissected after 10 minutes. (A), Images of male tissues (upper panel) and female mice (lower panel). (B), Images of coronal sections through the cerebral cortex of a male and female mouse brain. CC - Cerebral Cortex, Th - Thalamus, Hth - Hypothalamus. (c), Image of the underside of the male brain, showing pituitary and optic nerve bundles. Figure represents a greyscale photograph overlaid with a pseudocolour representation of bioluminescence. Images are representative of the pattern seen in several mice.

