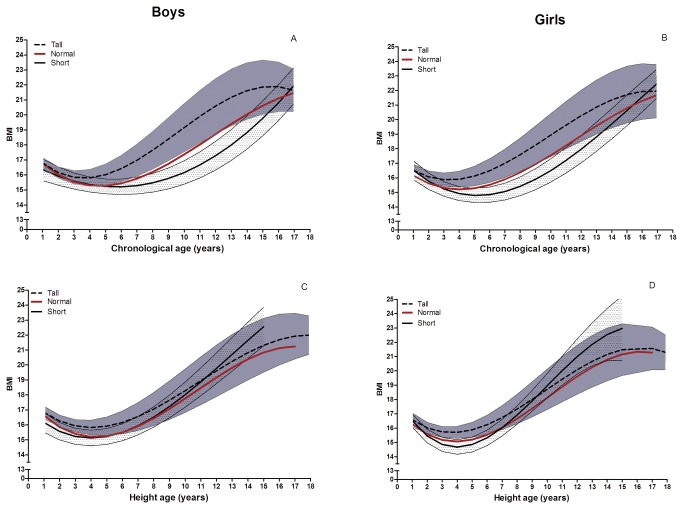
Figure 1. Smoothed median BMI curves for the short (mean height SDS -1.6), normal (mean height SDS 0), and tall (mean height SDS +1.6) sample.
BMI according to chronological age for boys (A), girls (B) and BMI according to height-age for boys (C) and girls (D). The dotted lines and the shaded area represent the median BMI and confidence intervals of the tall sample and the short sample, respectively.

