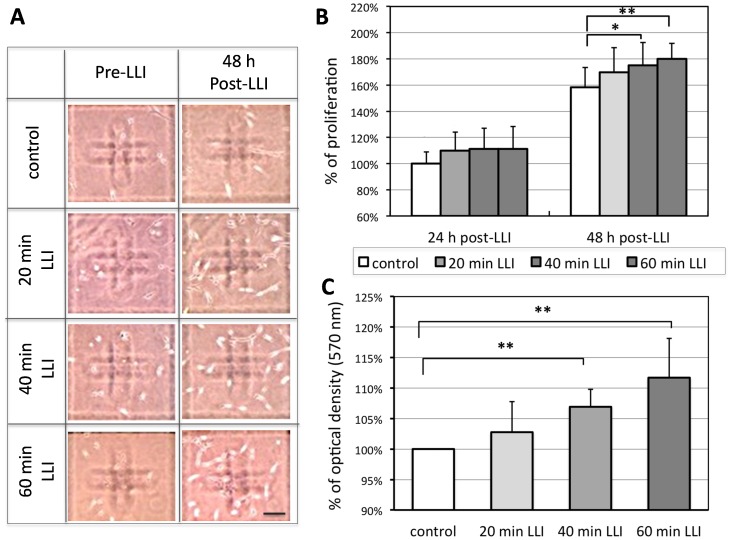
Figure 1. Effects of LLI on the number of A-172 cells.
A: Sample images of A-172 cells under light microscope. The number of cells increased 48 h post-LLI (right column) after 20, 40, 60 min LLI compared to pre-LLI (left column). Cal.: 100 µm. B: Proliferation ratio (the ratio of cell number at 24 or 48 hours following LLI and cell number before LLI) was normalized to control (no LLI) (n = 12 for each group). C: A summary of colorimetric analysis by MTT staining performed at 48 h after LLI (each group: n = 16). The optical density of each group was normalized to the value of control group (no LLI) at 48 h after initial condition. Asterisks: one-way ANOVA, * p<0.05, ** p<0.01.

