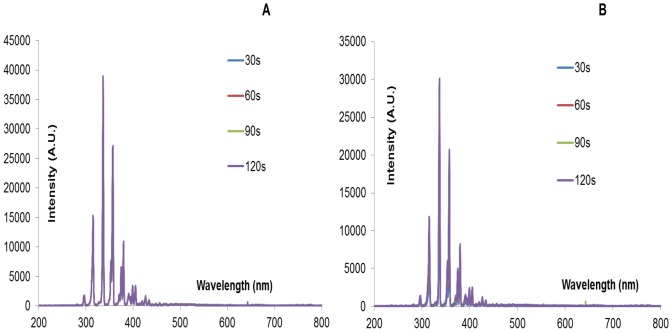
Figure 8. Spectral signature of (A) a clean FR4 device (B) an inoculated FR4 device i.e. a device on which 20 µl of E. coli was applied uniformly.
Spectral signature was recorded every 10s. Devices were powered for a total of 2 minutes. Only spectra at 30s, 60s, 90s and 120s are shown. Y-axis lists emission intensity in arbitrary unit.

