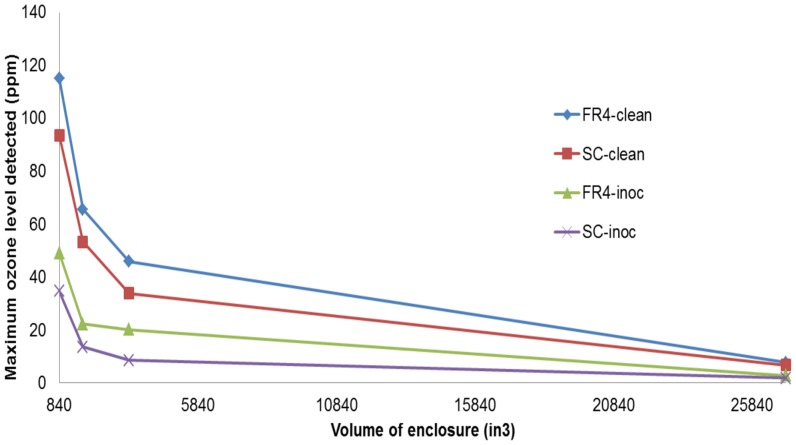
Figure 10. Variation of the maximum ozone levels w.r.t the volume of the acrylic enclosure.
Four plots are shown. Each plot shows the maximum ozone level noted in each enclosure for the respective device. “FR4-clean” shows this plot for a clean FR4 device, generating plasma for 1 minute. “FR4-inoc” shows this plot for an inoculated FR4 device, generating plasma for 1 minute. “SC-clean” shows this plot for a clean semi-ceramic (SC) device, generating plasma for 1 minute. “SC-inoc” shows this plot for an inoculated semi-ceramic (SC) device generating plasma for 1 minute.

