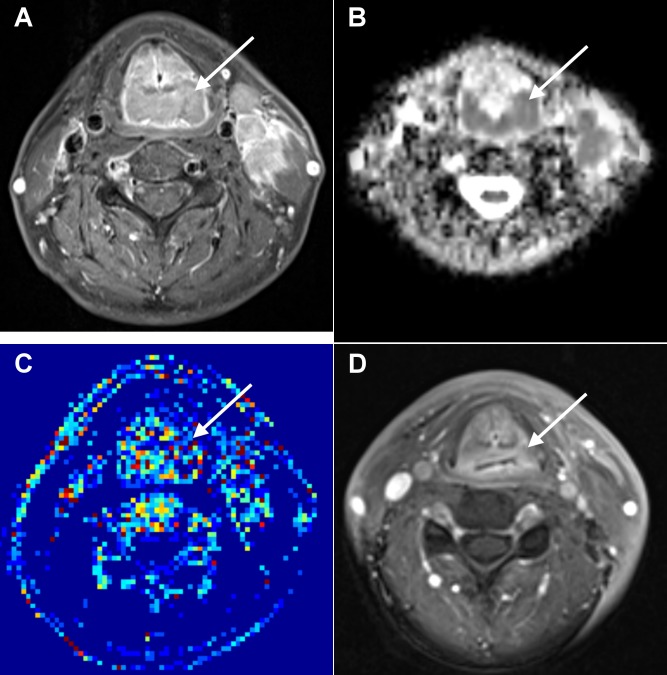
Figure 3. Local failure in a 61-year-old man with oropharyngeal SCC after chemoradiation.
A. A pretreatment axial-enhanced MRI shows the oropharynx tumor (arrow). B. The corresponding PWI map shows the tumor with a K trans value of 0.336 min-1. C. The corresponding ADC map shows the tumor with an ADC value of 0.76 × 10⁻³ mm2/s. D. Post-treatment axial-enhanced MRI shows a residual left oropharynx tumor (arrow) which was proven by endoscopic biopsy.

