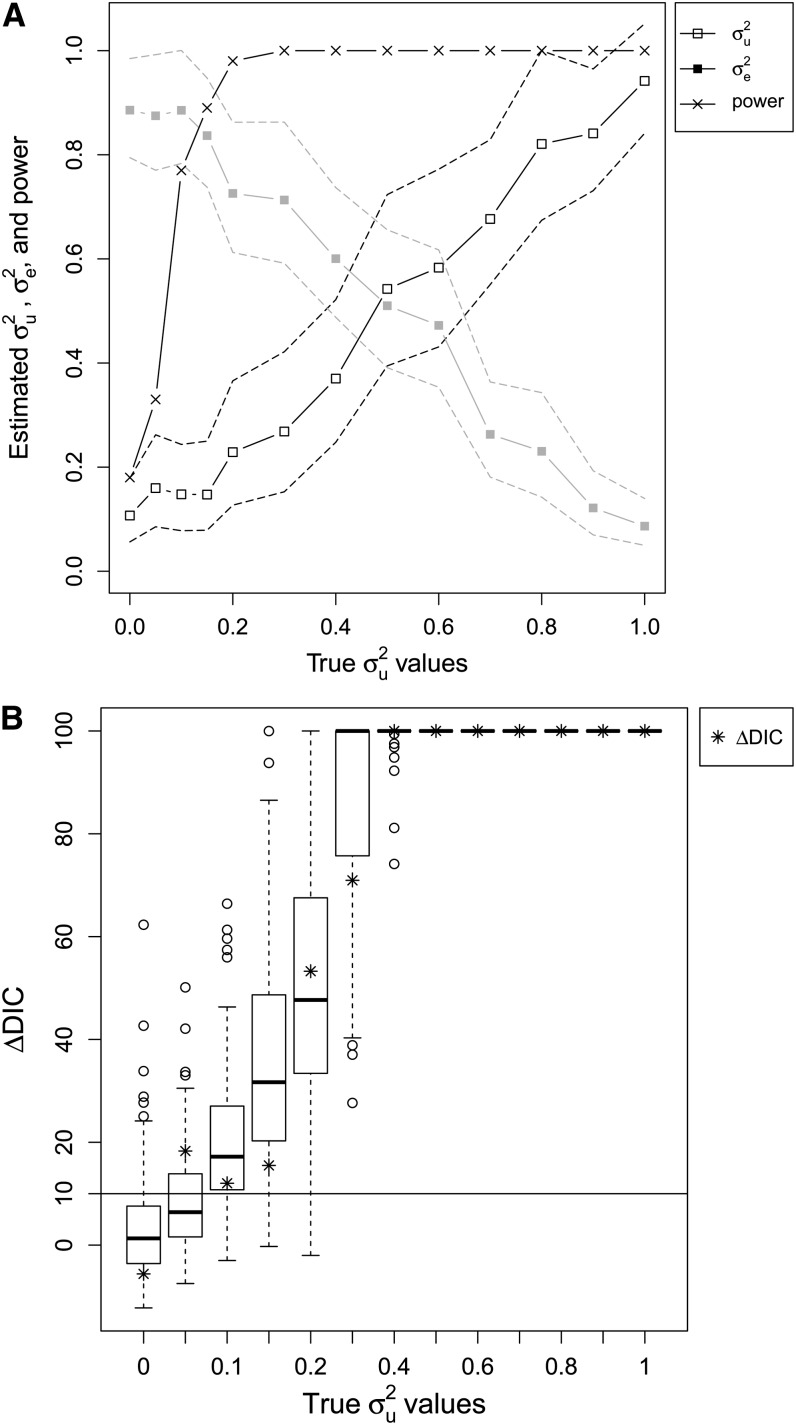
Figure 1.
Results from the synthetic Gaussian case study. (A) Posterior mean (solid lines) with 95% CI (dashed lines) for (black and open squares) and (gray and closed squares) from the Gaussian synthetic case study against the value of used in the simulations (together with ). The power of a model selection test using ΔDIC > 10 as limit is plotted as x and solid lines. The power is estimated using the simulation approach described in the text. (B) Boxplots of simulated values of ΔDIC against the value of used in the simulations (together with ). The values of ΔDIC from the synthetic case study are plotted as stars. ΔDIC equal to 10 is indicated by a horizontal line.

