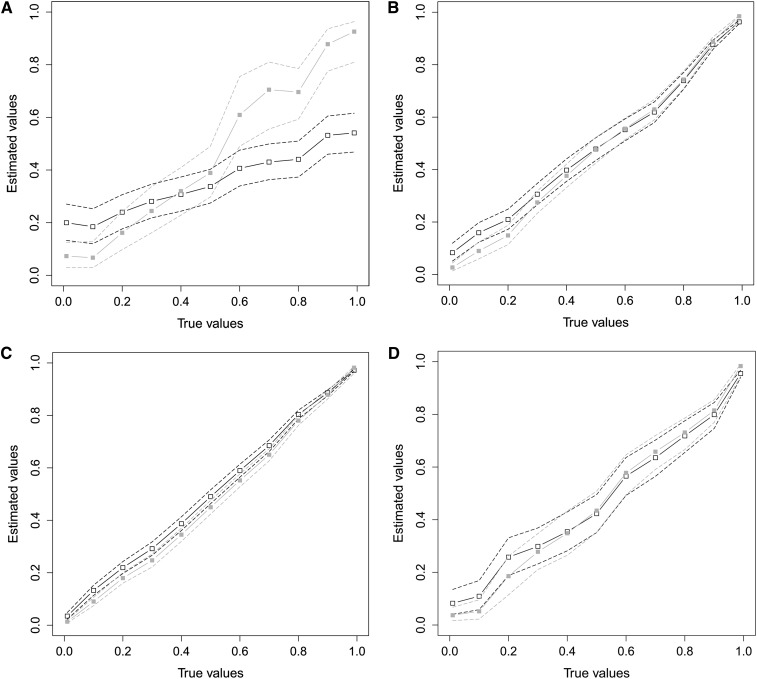
Figure 2.
Results from the synthetic Binomial case study. True vs. estimated heritability: posterior mean (solid line) and 95% credible intervals (dashed lines) for INLA (black, open squares) and MCMC (gray, closed squares). The number of trials is in (A) 1, (B) 2, (C) uniform between 1 and 9, and (D) distributed as in the house sparrow data set.

