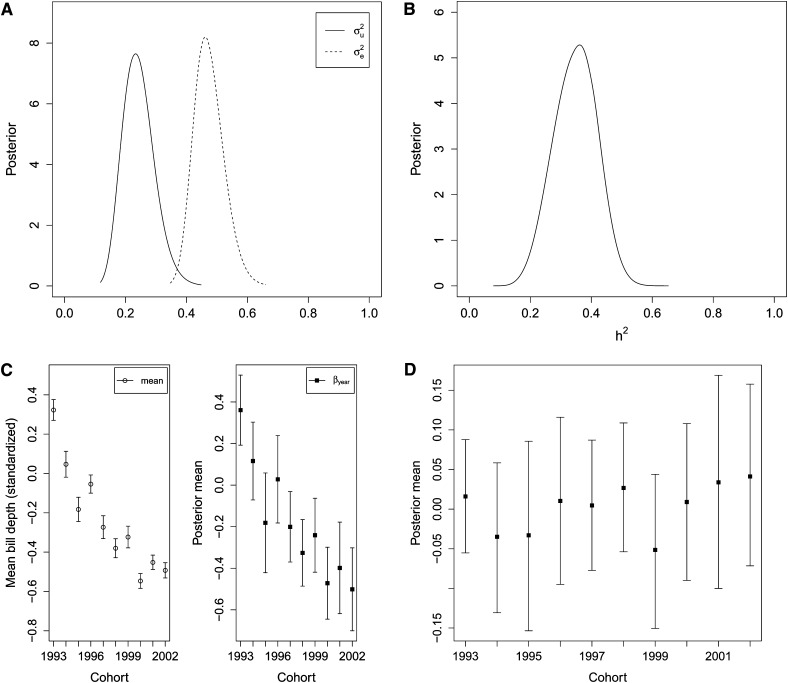
Figure 3.
Results from house sparrow case study on bill depth. All posterior estimates are obtained using INLA. (A) Posterior distribution of (solid line) and (dotted line). (B) Posterior distribution of heritabililty h2. (C) Left: Mean phenotopic (standardized) bill depth for each hatch year (with 95% confidence interval). (C) Right: Posterior mean (with 95% credible interval) of the levels βyear for the factor year. (D) Posterior mean (with 95% credible interval) for average breeding values for each hatch year.

