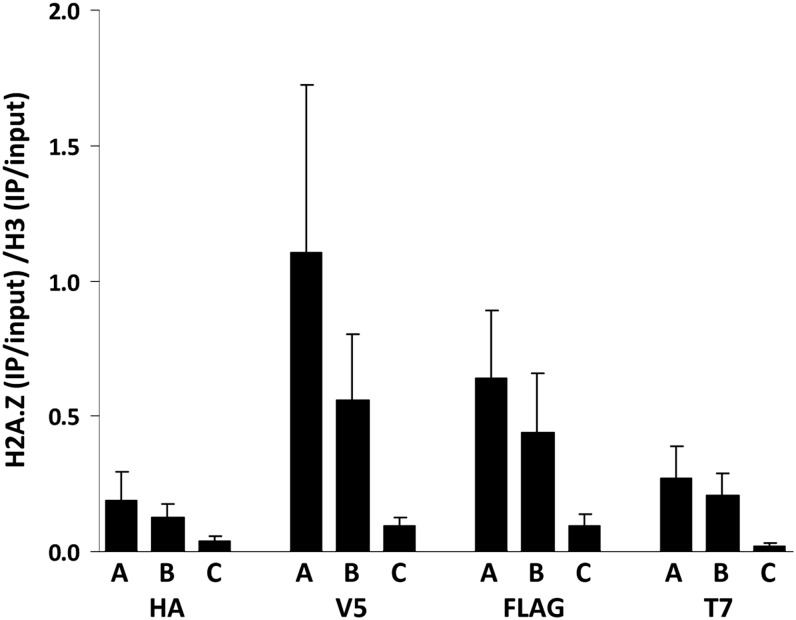
Figure 5.
Validation of RITE tags in ChIP assays. RITE-ChIP of H3 and H2A.Z followed by qPCR analysis of three loci: A = PTC6, B = RSA4, C = SPA2. The regions around the transcription start sites of PTC6 and RSA4 have high H2A.Z occupancy; the SPA2 region is located at the 5′ end of the SPA2 coding sequence and has low H2A.Z occupancy (primer sequences are listed in Table 3). ChIP signals were normalized over the corresponding inputs. The relative ChIP efficiency (H2A.Z/H3 on each of the three loci examined) varied between the four epitope tags. Average of three biological replicates ± SEM. Results were obtained from: HA-ChIP on strains NKI2178 (H3-HA-6xHIS→T7) and NKI8030 (H2A.Z-HA-6xHIS→T7), V5-ChIP on strains NKI8050 (H3-V5→HA-6xHIS) and NKI8053 (H2A.Z-V5→HA-6xHIS), FLAG-ChIP on strains NKI8052 (H3-2xFLAG→HA-6xHIS) and NKI8055 (H2A.Z-2xFLAG→HA-6xHIS), and T7-ChIP on strains NKI8051 (H3-2xT7→HA-6xHIS) and NKI8054 (H2A.Z-2xT7→HA-6xHIS.

