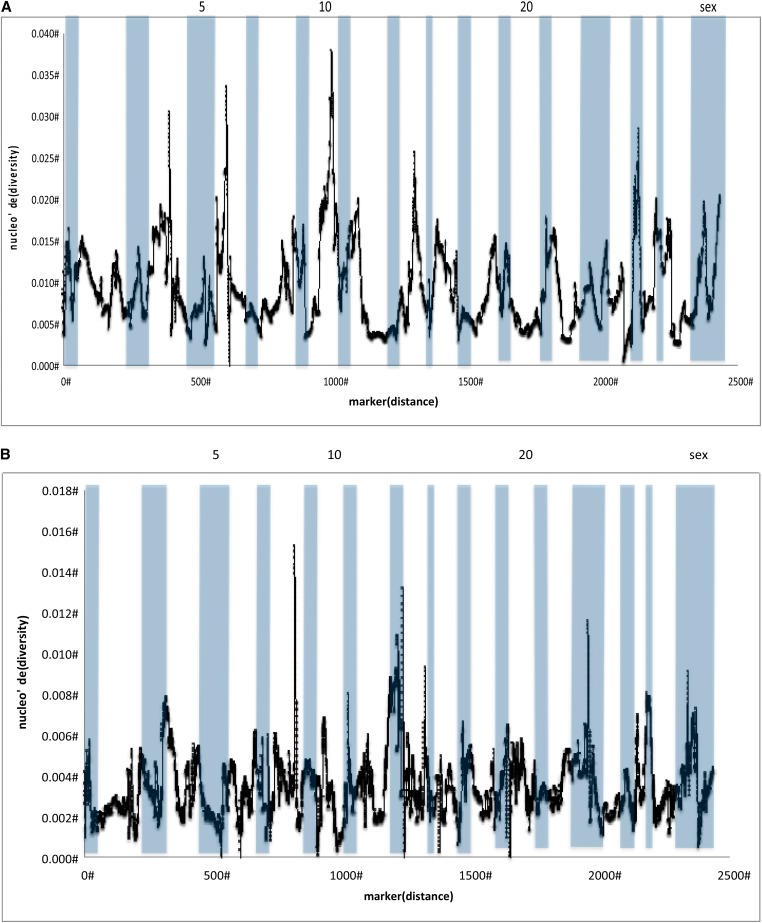
Figure 4.
Nucleotide diversity as calculated by Watterson’s theta in markers that mapped to two linkage maps of the O. mykiss genome (Miller et al. 2012; Hecht et al. 2012). The kernel-smoothed average for all markers that mapped is presented for (A) Sashin Creek migrants and (B) Little Sheep Creek samples. Chromosomes are alternately shaded with some chromosomes labeled.

