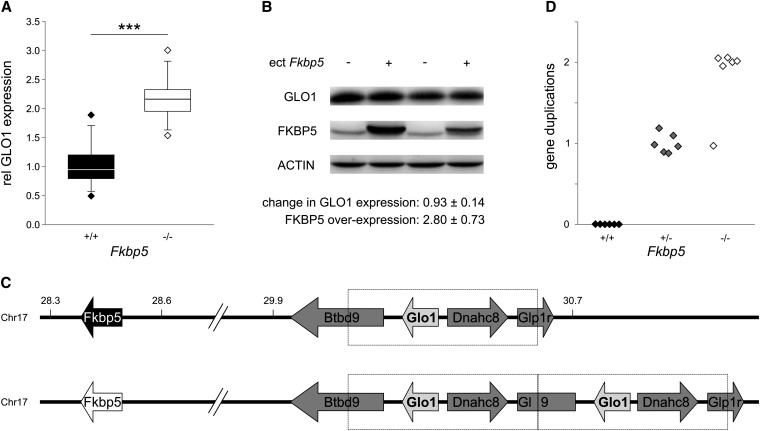
Figure 1.
(A) Comparison of GLO1 protein expression in hippocampi from Fkbp5−/− and Fkbp5+/+ mice. Hippocampi were prepared, and GLO1 expression was determined after protein extraction by Western blotting (polyclonal antibody; Santa Cruz Biotechnologies); signals were normalized to ACTIN (polyclonal antibody; Santa Cruz Biotechnologies). Expression difference was analyzed by Tukey’s test (n = 12 per genotype; P < 0.001). (B) Overexpression of Fkbp5 in HEK-293 cells by transient transfection did not affect GLO1 levels. Cells were transfected with Fkbp5 expressing or control vector, and protein levels were determined in cell extracts by Western blotting 3 d later. Mean protein levels ± SEM of GLO1 and FKBP5 (polyclonal antibody; Bethyl Laboratories) normalized to ACTIN are indicated (n = 5). (C) Scheme of genomic arrangement of Fkbp5 (28.5−28.4 Mb) and Glo1 (30.6−30.6 Mb) on chromosome 17 (28.3−30.7 Mb), without (upper) and with (lower) Glo1 gene duplication. The wild-type Fkbp5 allele (originating from C57BL/6 mice) is usually coinherited with a single copy of Glo1, whereas the knockout Fkbp5 allele (originating from 129SvJ mice) is coinherited with two copies of Glo1. (D) Verification of coinheritance of the Fkbp5 knockout allele with Glo1 duplication. Genomic duplications of the Glo1 spanning region were determined by quantitative reverse-transcription PCR (two independent PCRs per mouse) with primers against the duplication transition region [fw 5′-CTCTGCCCCAGAGAACAGTC and rv 5′-TGATAGAGGCCACACAGCAG (Williams et al. 2009)] and normalized to genomic levels of Npsr1 (determined by quantitative reverse-transcription PCR with the following primers: fw 5′-CAGCTGCTGCCCCGGCTAAC and rv 5′-GGTTGGCTGGCATGGCTCAGG).

