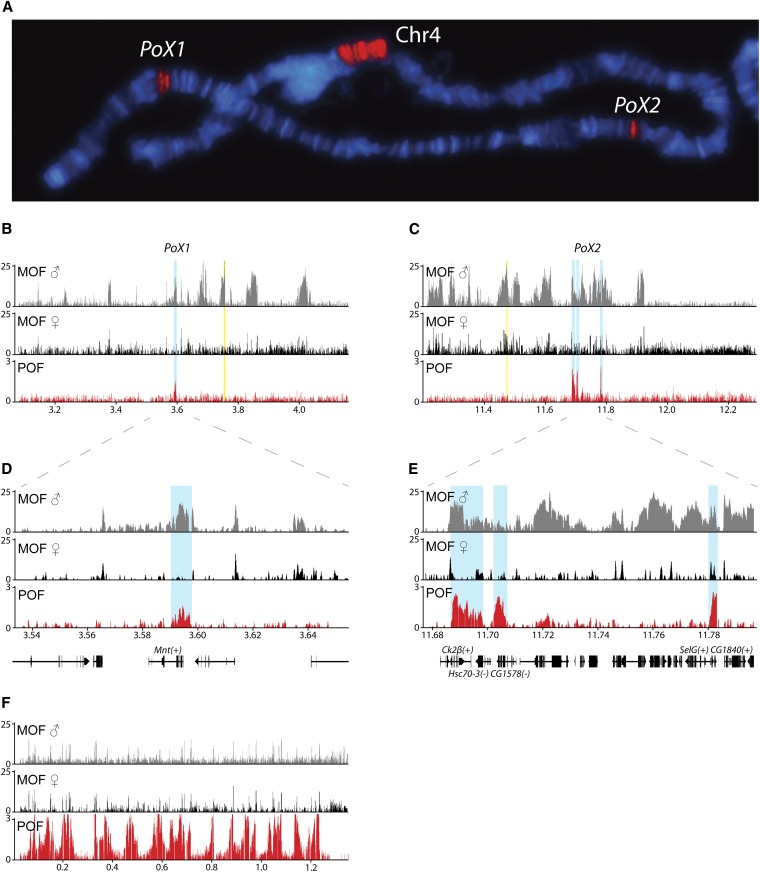
Figure 2.
POF binding profiles of the X-chromosome regions including PoX1 and PoX2. (A) Immunostaining of polytene chromosomes showing POF binding to the 4th chromosome (Chr4) and the two loci PoX1 and PoX2 as indicated. (B) POF binding profile from salivary gland tissue ChIP-chip. An ~1-Mb region including the PoX1 region (blue box) is shown. The binding profiles of MOF in males and females[from ChIP-seq (Conrad et al. 2012)] are shown for comparison. (C) POF binding profile in an ~1-Mb region including the PoX2 regions (blue boxes). The plots show the mean enrichment ratios obtained using a bandwidth of 200 bp for the POF ChIP-chip. Numbers on the x-axis denote chromosomal position along the chromosome in Mb. The y-axis shows ChIP enrichments as log2 ratios. PoX1 and PoX2 are located downstream of genes roX1 and roX2 (indicated by yellow boxes), respectively. The roX1 gene is transcribed from right to left and roX2 is expressed in the opposite direction. (D and E) High resolution profiles of enrichment at the PoX1 (D) and PoX2 (E) sites. The genes bound by POF are indicated; genes expressed from left to right are indicated by (+) and genes expressed in the opposite direction are indicated by (−). (F) Profile of POF binding on the 4th chromosome (~1.3 Mb) is shown for comparison.

