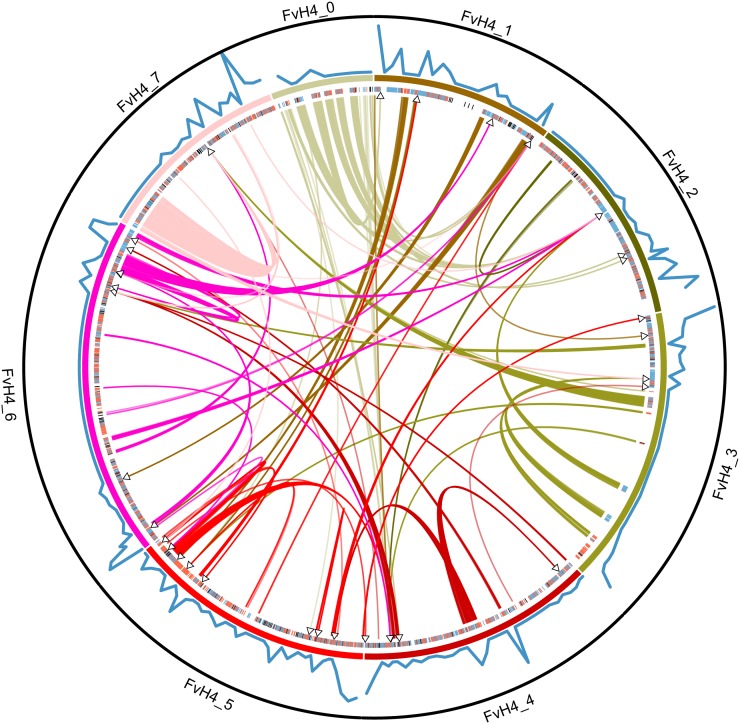
Figure 2.
Circular map of F. vesca ssp. vesca reference genome (FvH4; pseudochromosomes 0−7 are displayed in a circle) with F. vesca ssp. bracteata genomic data (Fvb) indicated (created with Circos; Krzywinski et al. 2009). Targeted capture markers polymorphic in the mother (blue), father (red), or both (black) are indicated as tick marks just inside the chromosomes. Translocations identified in our Fvb linkage map are indicated by curved links between different regions of FvH4, colored to match their location on FvH4, with arrowheads indicating their estimated position in Fvb. Recombination rate is indicated by a blue line along the outside of the chromosomes. The maximum value observed for recombination rate (20.4 cM/Mb) is indicated by the black circle encompassing the figure. Scaffolds scA and scB not shown.

