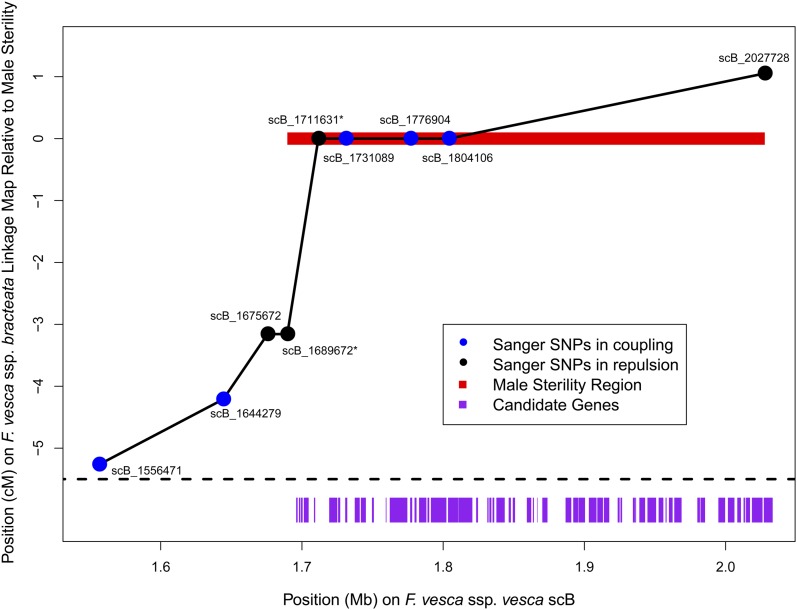
Figure 5.
Fine-mapping of the candidate region with Sanger sequencing. Each informative SNP (circle) is plotted according to its position on scB (x-axis) and its mapped position based on observed recombination among 95 offspring (y-axis). SNPs are colored according to whether they are in coupling (i.e., cis; blue) or in repulsion (i.e., trans; black) with the inferred male-sterility locus. Most SNPs were genotyped in the full sample of offspring (n = 93−95), but two SNPs (marked with asterisks) were only genotyped in a subset of individuals including all potential recombinants as inferred from the other SNPs (n = 13). The 338-kb region consistent with a perfect match to sex is shown in red, and genes in this region are indicated with purple rectangles (Table 2).

