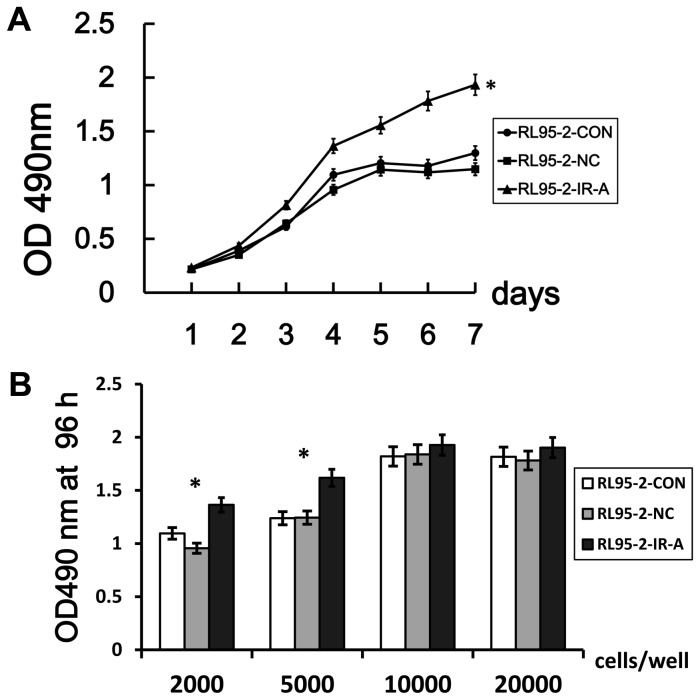
Figure 3. IR-A overexpression increases cell proliferation rate.
A. Proliferation of RL95-2–IR-A, RL95-2–CON and RL95-2–NC cells was measured over a 7-day period (plate 2000 cells/well as starting cells) B. Proliferation of the three cells was measured after 72 hours (plate 2000, 5000, 10000, 20000 cells/well as starting cells). 6 replicate wells were included per sample and the data points were present as means±SD. *, P < 0.05 vs. control.

