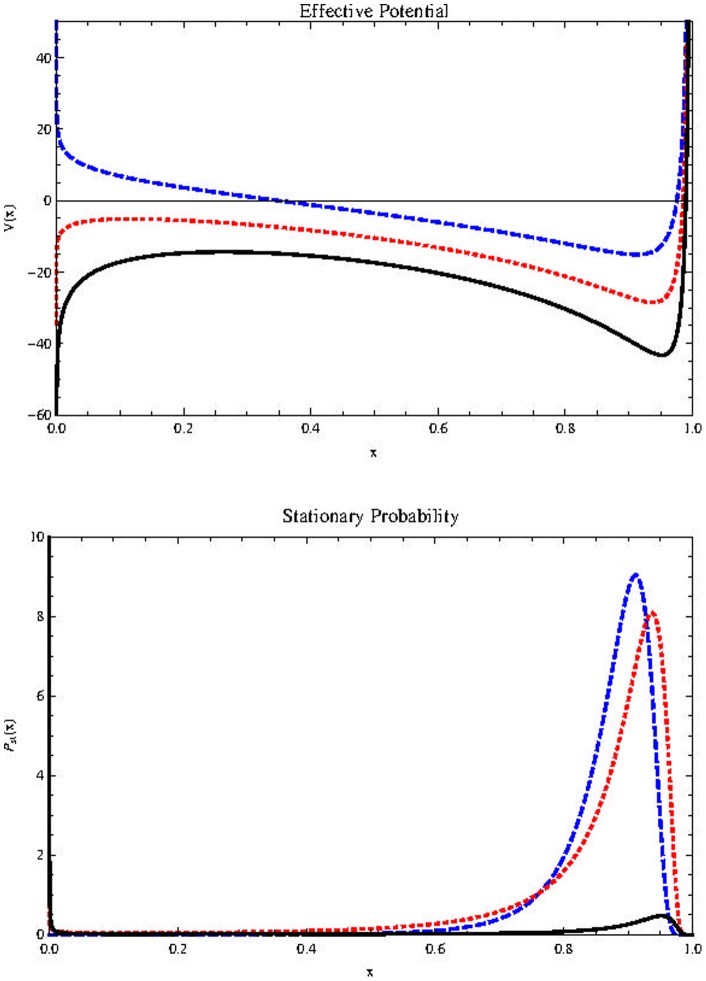
Figure 3. Effects of noise intensity on  and
and  .
.
Effect of  on
on  (on the top) and
  (at bottom) for
  Horizontal axis represents population size
  Blue, dashed curve:
  Red, dotted:
  Black, thick:
  Other parameters are as in figure (2). For sufficiently high values of
  the CSCs population is extinguished.

