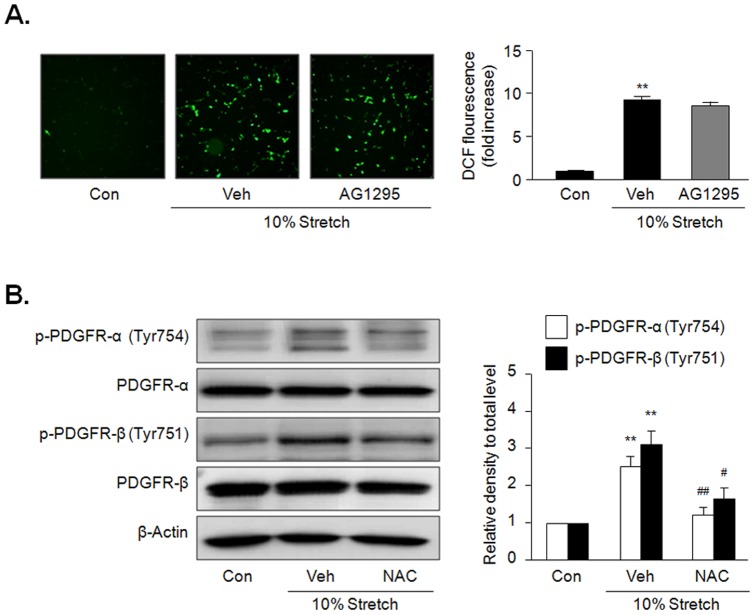
Figure 5. Involvement of ROS in MS-induced PDGFR phosphorylation.
(A) Cells were stimulated by 10% MS for 10 min, and ROS was determined using DCF fluorescence. Quantitative data for the corresponding DCF fluorescence in the left are presented as means ± SEM (n = 4). **p<0.01 vs. control (Con). (B) Cells were stimulated by 10% MS for 10 min in the presence or absence of NAC (0.5 mM), a ROS inhibitor, and the levels of phosphorylated and total PDGFR isoforms (PDGFR-α and PDGFR-β) were determined by immunoblotting. Quantitative data for the corresponding blots in the left panel are presented as means ± SEM (n = 5). **p<0.01 vs. corresponding control (Con). #p<0.05, ##p<0.01 vs. corresponding vehicle (Veh).

