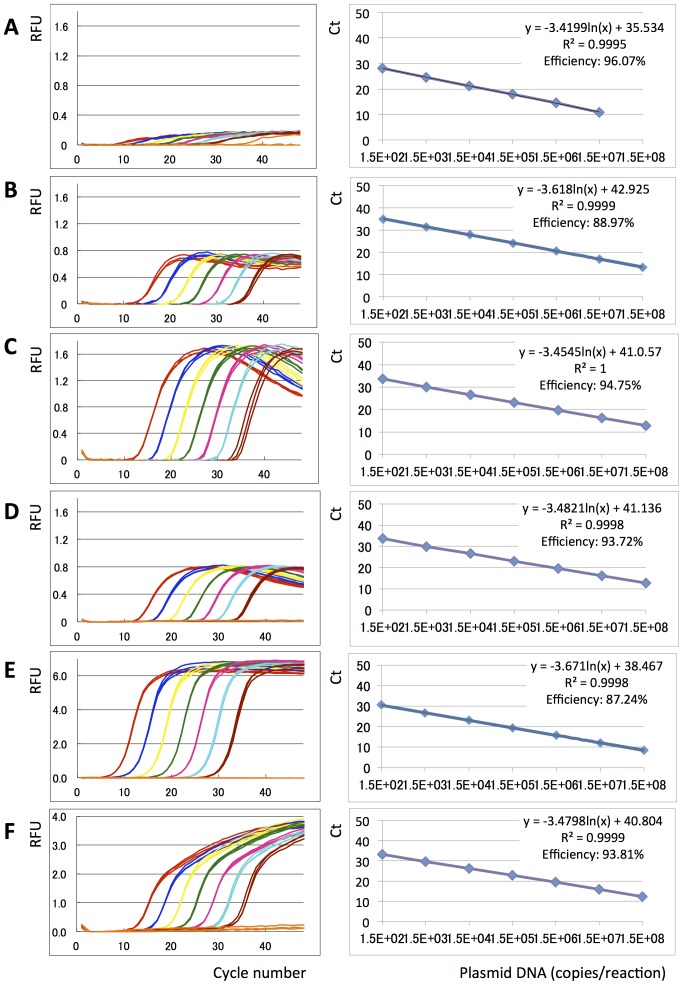
Figure 4. Eprobe mediated real-time PCR monitoring.
Real-time PCR experiments were performed using different Eprobes, a TaqMan probe, SYBR Green I, Amplitaq and different concentrations of an EGFR wild-type plasmid DNA template. Amplification curves (Random fluorescent units (RFU) plotted against PCR cycle number) using a 7 times serial dilution of the DNA template are shown on the left, and PCR efficiency plots (Ct values plotted against logarithm of plasmid DNA concentrations) are shown on the right. Plasmid DNA concentrations are indicated by colors: Red: 1.5×10⁸ copies, Dark blue: 1.5×10⁷ copies, Yellow: 1.5×10⁶ copies, Green: 1.5×10⁵ copies, Pink: 1.5×10⁴ copies, Sky blue: 1.5×10³ copies, Brown: 150 copies, Orange: TE negative control. A: Eprobe 203-10 wt TO, B: Eprobe 205-13 wt TO, C: Eprobe 215-21 wt TO, D: Eprobe 215-21 wt TP, E: SYBR Green I, F: TaqMan probe. Triplicate data are shown for each experiment. For Eprobe 203-10 wt early Ct values for the highest template concentration were not recorded by the PCR machine.

