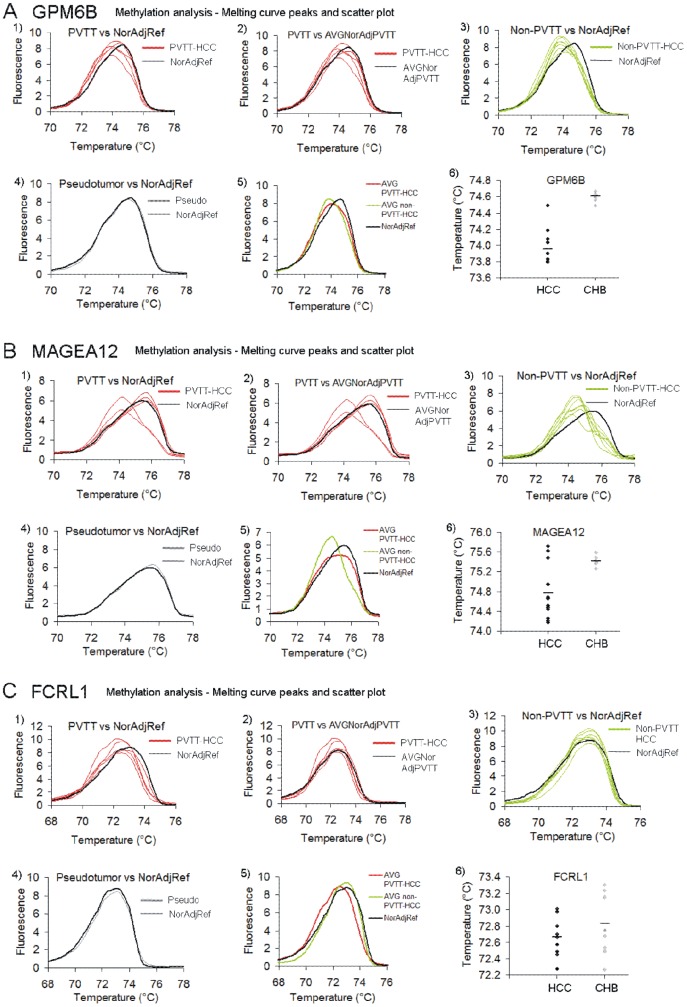
Figure 2. Methylation levels of GPM6B, MAGEA12 and FCRL1 promoters in HCC and non-cancerous tissue as measured by HRM.
(A–C) Melting curve peaks of GPM6B (A), MAGEA12 (B) and FCRL1 (C) amplicons in 12 tumor samples and 12 matched adjacent normal tissues. The peaks for HCC with PVTT (PVTT-HCC), HCC without PVTT (non-PVTT-HCC), and pseudotumor subjects were compared with the average of normal adjacent tissues from non-PVTT patients (NorAdjRef). In the second panel, melting peaks for tumor samples of HCC patients with PVTT were plotted together with the average of matched adjacent normal tissues from these patients, whereas the fifth panel shows the average of HCC with PVTT and HCC without PVTT in comparison with NorAdjRef. Temperature values for melting peaks in every patient are shown in scatter plots and in Table 3.

