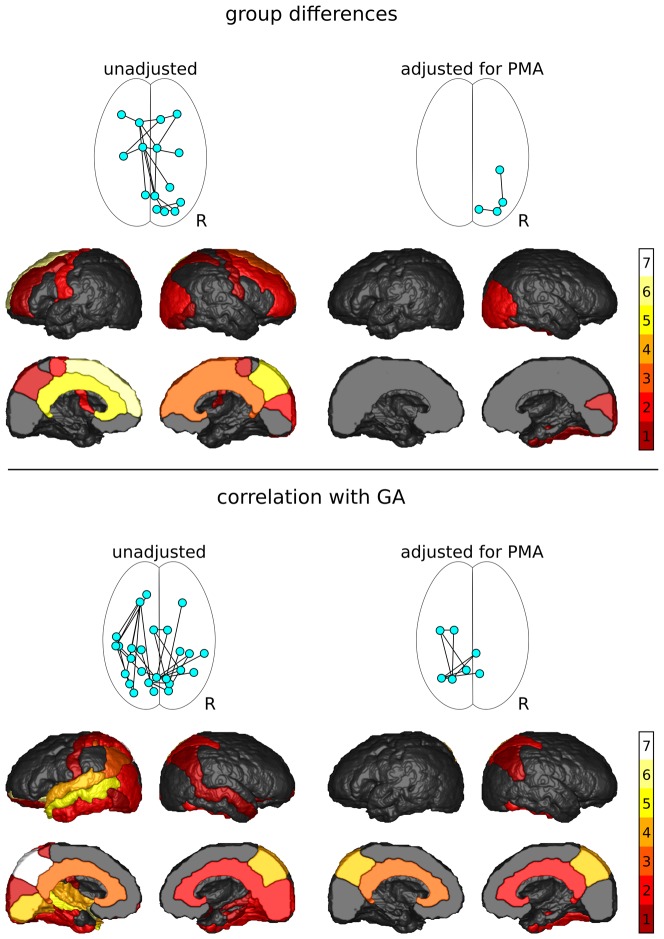
Figure 3. Results of the NBS analysis of T2.
Shown are the network components with significantly increased T2 in preterm infants and the frequency with which cortical regions were associated with changes in T2 of their connections (top), and network components in which T2 correlated with gestational age (GA; bottom).

