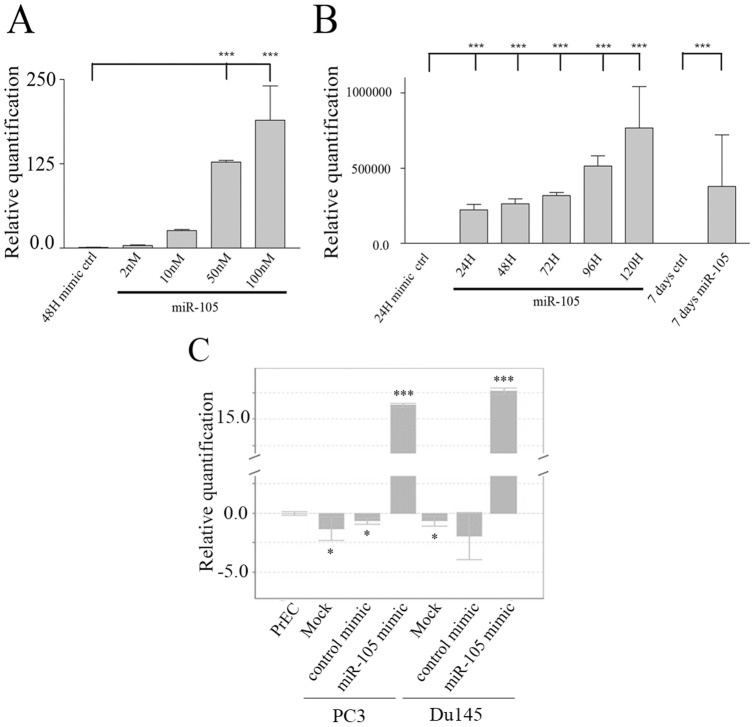
Figure 2. Evaluation of efficacy of MIRIDIAN mimics for modulation of miR-105 levels.
(A) PC3 cells were treated with increasing concentrations (2, 10, 50, 100 nM) of miR-105 specific or 100 nM control (cel-miR-67) mimics (Dharmacon). After 48 hours samples were evaluated for relative levels of miR-105 using TaqMan qRT-PCR. miR-105 levels specifically increased in a dose-dependent fashion in miR-105 compared to control mimic transfected cells. The graph represents the mean and standard error of 8 replicates from one experiment. Similar trends were observed in other independent experiments. (B) PC3 cells were treated with 50 nM of miR-105 or control cel-miR-67 mimics, and relative levels of expression of miR-105 were assessed using TaqMan qRT-PCR. miR-105 expression increased over time, and peaked at 120 hours post-transfection before declining, while miR-105 levels remained similar in control mimic-transfected cells over time. In all cases levels were normalized to endogenous levels of RNU24 as an internal control. The graph represents the mean and standard error of 3 replicates from one experiment. Similar results were observed in other independent experiments. *** represents p<0.001 as compared to control mimic-transfected cells for panels A and B. (C) Levels of miR-105 were determined in untransfected PrEC, PC3 or DU145 cells and compared to levels in PC3 or DU145 cells transfected with 50 nM miR-105 or cel-miR-67 mimics. In all cases levels were normalized to endogenous levels of RNU24 as an internal control, and to endogenous levels in PrEC. Bars represent the mean and standard error of 3 replicates from one experiment. Similar results were observed in other independent experiments. * represents p<0.05 and *** represents p<0.001.

