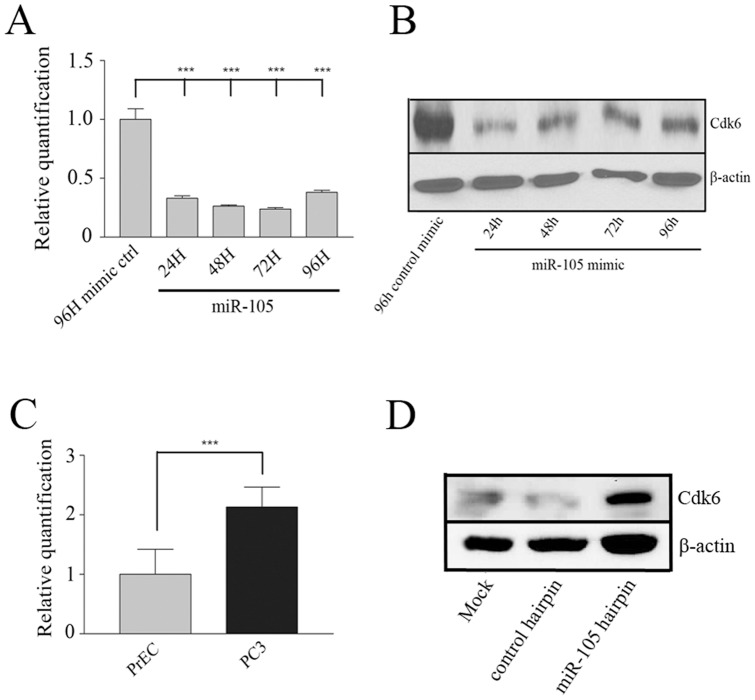
Figure 7. miR-105 results in decreased Cdk6 expression at both the mRNA and protein levels.
(A–B) PC3 cells were transfected with 50 nM miR-105 or control mimics as described in materials and methods and relative levels of Cdk6 expression were assessed over time. Both the mRNA and protein samples were isolated from paired dishes of transfected cells for each condition. (A) Relative levels of CDK6 mRNA were determined following qRT-PCR analysis and normalization to endogenous levels of β-actin as a control. The graph represents the mean and standard error of triplicate dishes from one experiment. Similar trends were observed in other independent experiments. *** represents p<0.001. (B) Cdk6 protein levels were assessed by western blot analysis. Blots were reprobed for levels of β-actin as a loading control for total protein. We observed a significant decrease in both Cdk6 mRNA and protein expression in miR-105 overexpressing as compared to control mimic-transfected PC3 cells. Blots were repeated a minimum of three independent times. (C) CDK6 mRNA levels were also compared between normal PrEC cells and cancerous PC3 cells using qRT-PCR and normalization to endogenous β-actin levels as a control. Consistent with expressing reduced endogenous miR-105 levels, PC3 cells had higher CDK6 expression when compared to PrEC. The graph represents the mean and standard error of triplicate samples from one experiment. Similar trends were observed in other independent experiments. *** represents p<0.001. (D) PrEC were either mock transfected or transfected with hsa-miR-105 or cel-miR-67 hairpin inhibitors, and Cdk6 levels assessed by western blot analysis. Blots were reprobed for β-actin as a loading control for total protein. Cdk6 levels were significantly elevated in PrEC transfected with miR-105 as compared to controls. Blots were repeated two independent times with similar results.

