
Fig. 1.
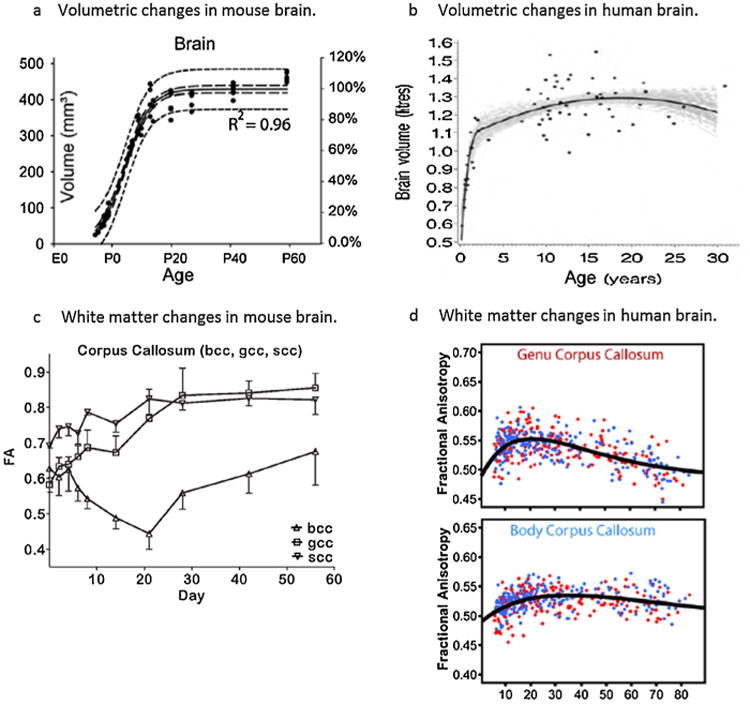
Temporal changes in postnatal brain development in rodents and humans, as assessed by magnetic resonance imaging. (a) Total mouse brain volumes on the left vertical axis (also expressed as % adult volume; right axis) measured between embryonic day 12 and pnd 60. Measurements were fitted to a sigmoidal model with a 95% confidence interval (long dash lines) and 95% prediction band (short dash lines). Reprinted from Chuang et al. (2011), with permission from Elsevier. (b) Total human brain volumes measured between 3 monthsand30yearsofage, in a total of 71 males (females follows a similar trajectory; data not shown). Black dots represent the observed data; the black line indicates the estimated median growth curve, and gray lines represent a set of 100 credible growth curves as determined by simulations. Reprinted from Groeschel et al. (2010), with permission from Elsevier. (c) Fractional anisotrophy (FA) in the corpus callosum of rats between pnd 0 and pnd 56 (n = 4–6/time point). bcc, gcc and scc represent the body, genu and splenium of the corpus callosum, respectively. From Bockhorst et al. (2008); reprinted with permission from Wiley Interscience. (d) FA in the corpus callosum of human patients aged 5–83 years (n = 403); males and females are indicated by blue and red dots, respectively. Note that FA typically peaks at ∼20-30 years of age (early adulthood), which is roughly comparable to ∼pnd 60 in rodents. From Lebel et al. (2012); reprinted with permission from Elsevier.