
Figure 4. Reduction of anti-TH(+) neuron number in culture by MPP+.
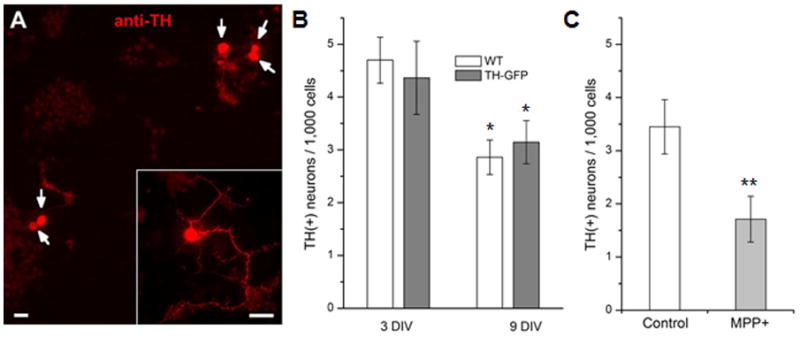
(A) A fluorescent image of cultured neurons strained with anti-TH. Five DA neurons (indicated with arrow) were observed in this field of view. Inset High power image shows TH(+) neuritic processes in addition to the soma. Scale bar=20μm. (B) Anti-TH (+) neurons were quantified at 3 and 9 DIV in wild type (WT) and TH-GFP lines. The number of anti-TH(+) neurons at 9 DIV was significantly reduced compared to that at 3 DIV (Student t-test, *P<0.05). In contrast, there was no difference between two fly lines. In this graph, the number of anti-TH (+) neurons was normalized to 1,000 DAPI (+) cells as described in Materials and Methods section. Data from 6 separate experiments. (C) A graph showing number of anti-TH(+) neurons in the absence and presence of 40μM MPP+. MPP+ was added at 3 DIV and neuronal cultures were stained with anti-TH antibody at 9 DIV. Data from 4 separate experiments. Student t-test, **P<0.01.