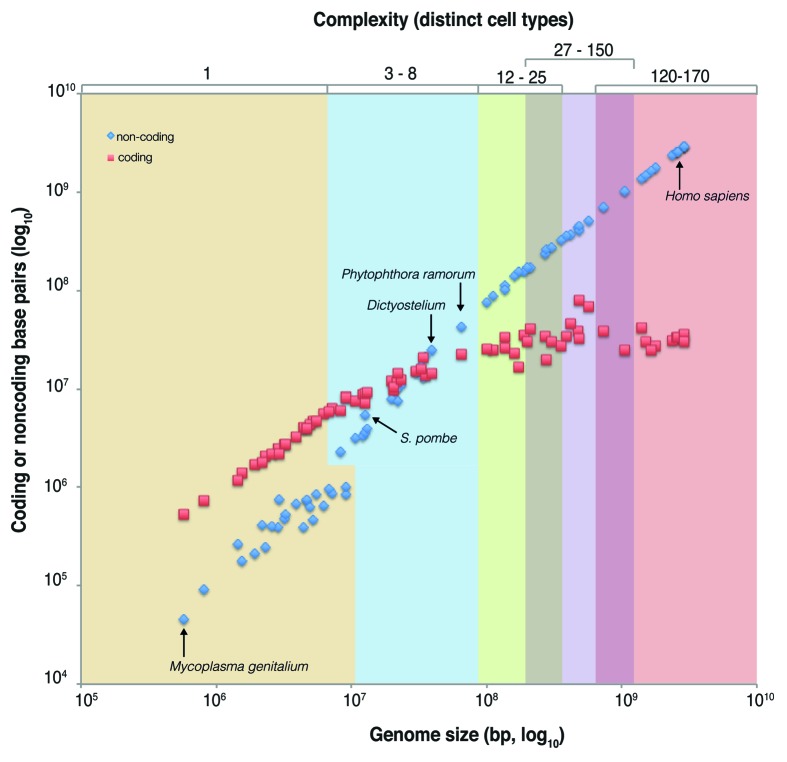
Figure 3. The relationship between biological complexity and genome composition. In this plot, the 73 organisms with a previously defined number of distinct cell types (e.g., relative biological complexity, see Table S1; ref. 35) are shown as pairs of data points, with one depicting total protein-coding sequence bases (red) and one total non-protein-coding bases (blue) which cumulatively give the total genome size (x-axis). Non-protein-coding sequence increases exponentially with the number of distinct cell types, while protein-coding sequence is asymptotic. Note that the intersection of the protein-coding and non-protein-coding data sets occurs among simple multicellular organisms.

An official website of the United States government
Here's how you know
Official websites use .gov
A
.gov website belongs to an official
government organization in the United States.
Secure .gov websites use HTTPS
A lock (
) or https:// means you've safely
connected to the .gov website. Share sensitive
information only on official, secure websites.
