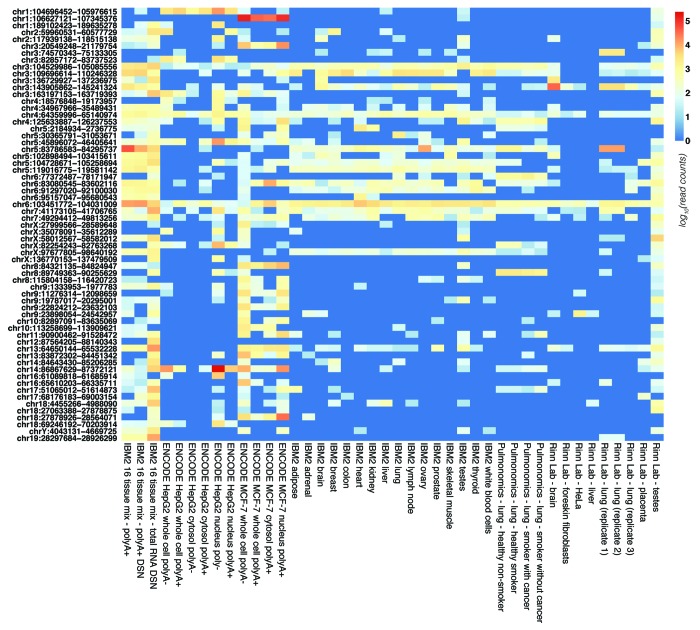
Figure 5. Heatmap of transcription across gene deserts. The relative expression of each of the 63 gene deserts with at least 1,000 RNA-seq read counts (from a single library) is shown for each of the 42 human RNA-seq data sets surveyed. Read intensity is scaled in log10 from 0 (blue) to greater than 5 (red). The IBM2 16 tissue mix total RNA DSN (16-tDSN) library reveals high levels of transcription across the vast majority of gene deserts.

An official website of the United States government
Here's how you know
Official websites use .gov
A
.gov website belongs to an official
government organization in the United States.
Secure .gov websites use HTTPS
A lock (
) or https:// means you've safely
connected to the .gov website. Share sensitive
information only on official, secure websites.
