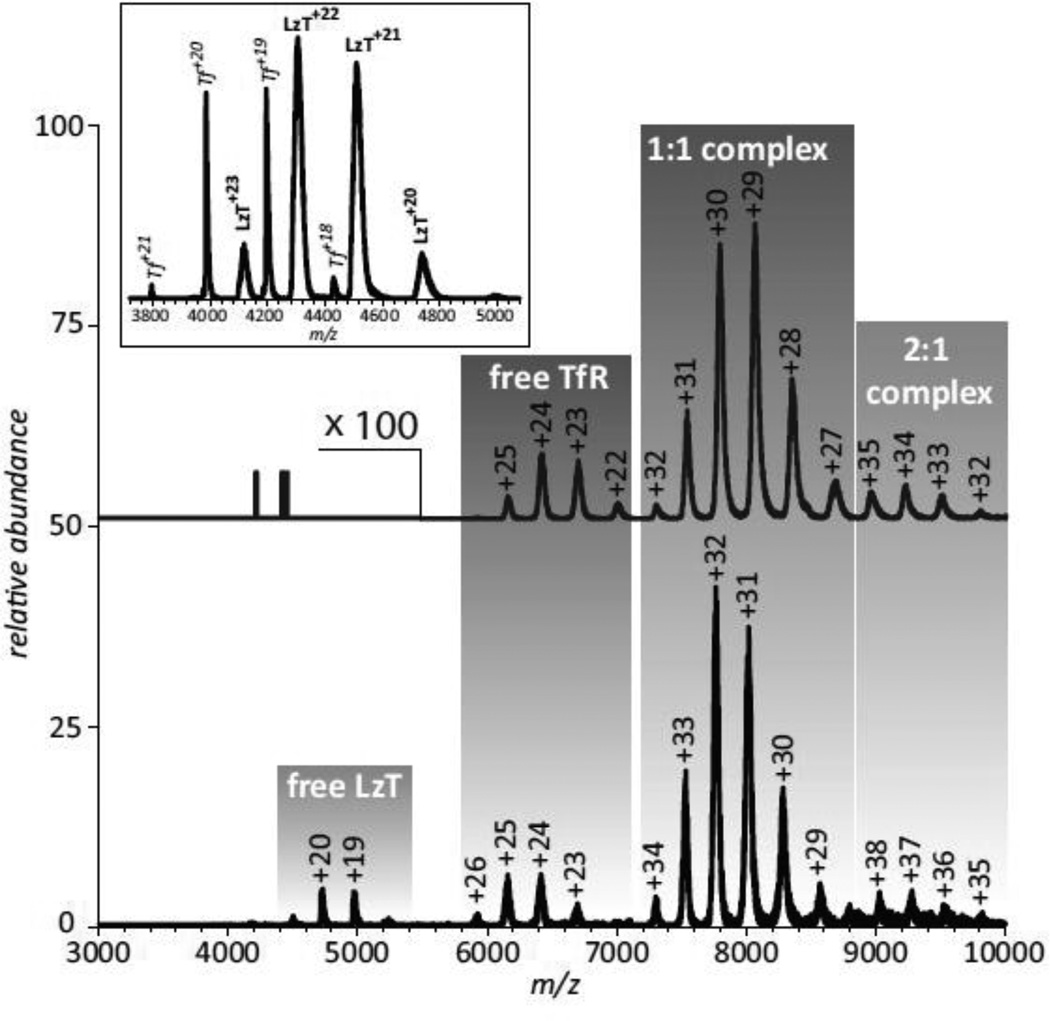
Figure 5.
ESI mass spectra of Tf/TfR (top) and LzT/TfR (bottom) mixtures acquired under near-native conditions (3 μM of each protein in 20 mM ammonium acetate at pH 7.1). Peak labels represent the charge states of all relevant ions. The inset shows a mass spectrum of LzT spiked with intact Tf. Adapted with permission from (70).

