Figure 6.
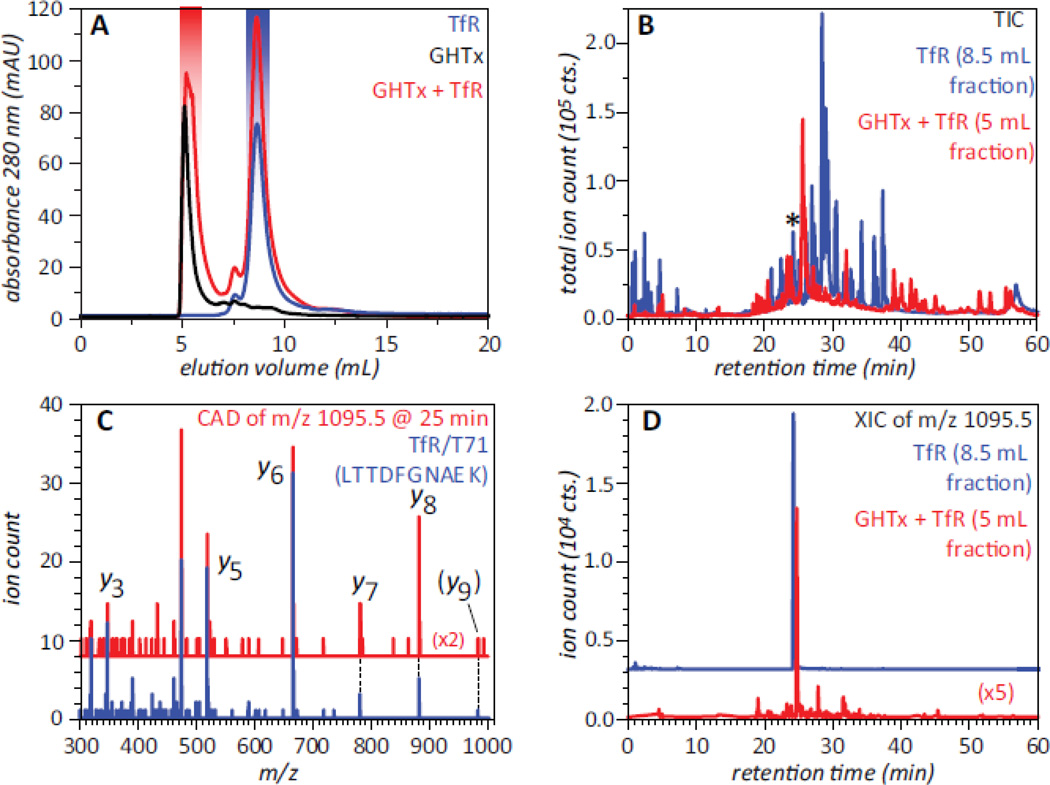
SEC of GHT oligomers, TfR and their mixture (A), and total ion chromatograms (B) of tryptic digests of the SEC fractions of TfR (blue trace) and the TfR/GHT oligomer mixture (red trace) highlighted in panel A. Panels C and D illustrate detection of TfR in the early-eluting SEC fraction of GHTx/TfR mixture (highlighted with red in panel A): single-scan MS/MS spectrum (C) and extracted ion chromatogram (D) of a tryptic peptide eluting at 25 min (marked with asterisk in panel B). The blue trace in panel C shows the reference MS/MS spectrum of a tryptic fragment T71 (LTTDFNAEK) of TfR, and the blue trace in panel D corresponds to this peptide derived from TfR in the absence of GHT oligomers (SEC fraction highlighted with blue in panel A). Adapted with permission from (20).

