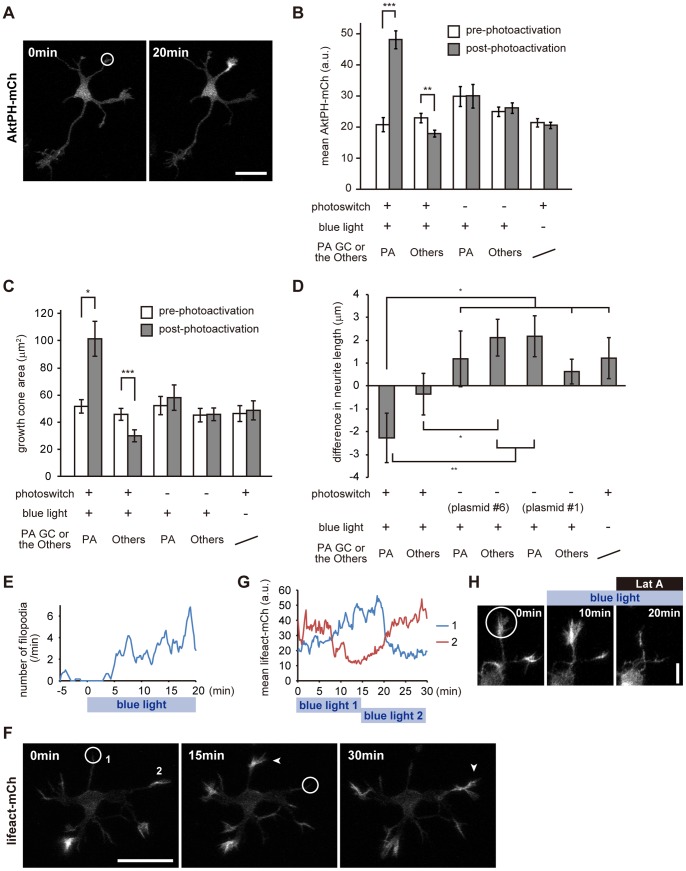
Figure 5. Local activation of the PI3K photoswitch in neuronal growth cones.
(A) AktPH-mCh fluorescence images of a hippocampal neuron expressing plasmid #3 before (left) and 20 min after (right) photoactivation (10% of 405-nm diode laser, 0.1 Hz). (B) Mean fluorescence for AktPH-mCh in whole growth cones before and 20 min after photoactivation. (C) Sizes of growth cones before and 20 min after photoactivation. (D) Changes in neurite length 20 min after photoactivation. In this experiment, we used two negative controls, PHR-iSH deleted (plasmid #6) and iSH deleted (plasmid #1), to rule out a possible effect of photodamage. (E) Time-course of the numbers of filopodia at a photoactivated growth cone of a hippocampal neuron expressing plasmid #3. Data were taken from Movie S5. (F) Fluorescence images of Lifeact-mCh. A neuron expressing AktPH-mVenus, the PI3K photoswitch and Lifeact-mCh was photoactivated consecutively at two separate locations (circles), for 15 min at each location. Lifeact-mCh fluorescence increased at each photoactivated area in turn (arrowheads). (G) Time-course of change in Lifeact-mCh fluorescence at the photoactivated growth cones. Numbers represent neurites numbered in (F). (H) Fluorescence images of Lifeact-mCh. A neuron expressing AktPH-mVenus, the PI3K photoswitch and Lifeact-mCh was locally photoactivated from 0 min and subsequently Latrunculin A (Lat A, 1 µg/ml) was applied at 10 min after photoactivation. Data are expressed as means ± s.e.m. in B, C and D (10–12 neurons). *P<0.05, **P<0.005, ***P<0.0005, paired t-test (B, C), two sample t-test (D). Scale bars represent 30 µm in A and F, and 10 µm in H. GC and PA stand for “growth cone” and “photoactivated”, respectively. The white circles indicate the photoactivated area. See Movies S4, S5 and S6.

