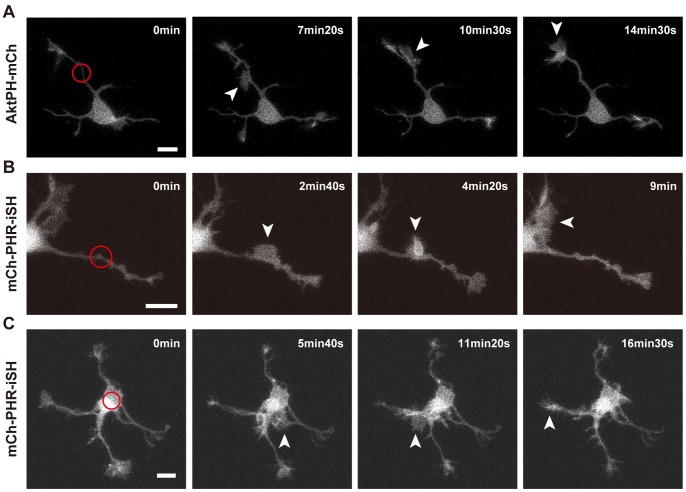
Figure 6. Local activation of the PI3K photoswitch in the middle of neurites or in the soma.
Fluorescence images of AktPH-mCh (A) or mCh-PHR-iSH (B,C). (A,B) The middle of a neurite expressing plasmid #3 (A) or #2 (B) was photoactivated. (C) The soma of a neuron expressing plasmid #2 was photoactivated. Scale bars represent 10 µm. Arrowheads indicate “waves”. The red circles indicate the photoactivated area. See Movie S7.

