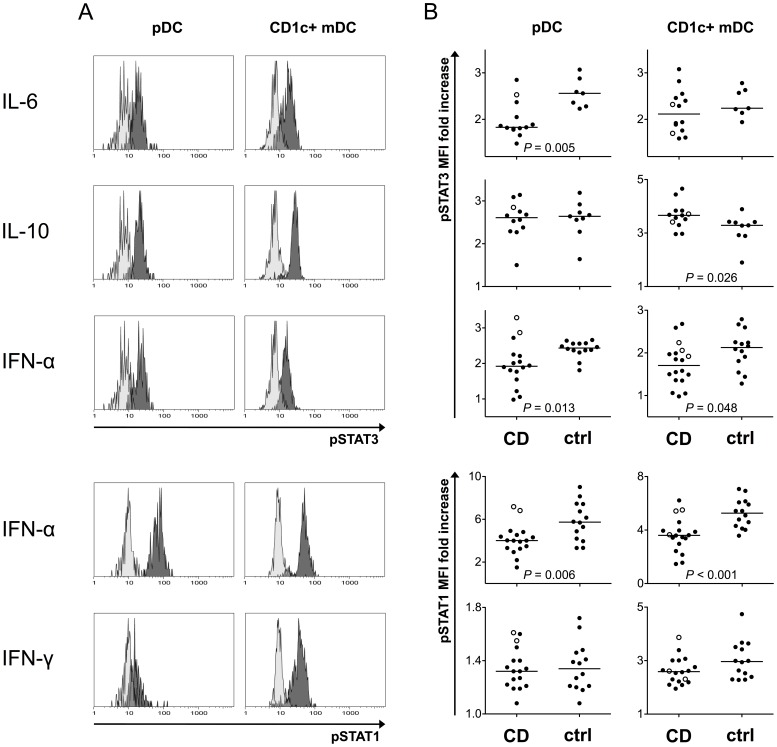
Figure 5. DCs from CD patients exhibit altered levels of phosphorylated STATs after cytokine stimulation.
Heparinized whole blood was stimulated with human recombinant cytokines for 10 minutes, and cells were then immediately fixed, permeabilized, and stained for phosphorylated STATs. CD1c+ mDCs and pDCs were identified as shown in Fig. 1B and 1C, respectively. Light-colored histograms represent unstimulated samples. A representative example of pSTAT staining patterns after cytokine stimulation is shown in a healthy control (A). pDCs from patients exhibit a decreased response to IL-6, whereas IL-10 induces similar levels of pSTAT3 in both groups. In CD1c+ mDCs, pSTAT3 levels after IL-10 stimulation are higher in patients, and no difference is seen in the IL-6 response. IFN-α stimulation results in a lower levels of pSTAT1 and pSTAT3 in both DC subsets in CD, but pSTAT1 responses to IFN-γ stimulation are similar with the healthy controls. Values represent fold increase of median fluorescence intensity over unstimulated control. Infliximab-treated patients are indicated by open circles. Horizontal lines indicate median levels (B).

